

Straight lines are everywhere. A taxi fare that grows by the same amount every mile. A phone plan with a flat monthly fee plus a cost per gigabyte. A savings jar that gains the same amount each week.
All of these follow one simple pattern. In math, that pattern is called a linear equation.
The name sounds scary. The idea is not. A linear equation is just a rule that draws a straight line. Once you see how it works, solving and graphing become almost like a game.
This guide walks you through it step by step. We’ll define the terms, master the key formulas, solve real equations, and graph lines on a coordinate grid. No jargon walls. Just clear, friendly help.
Grab a pencil and some graph paper. Let’s build your confidence.
Linear Equations Cheat Sheet
| Detail | Info |
|---|---|
| Equation Forms | Slope-Intercept Form and Standard Form |
| Core Variables | x (horizontal axis) and y (vertical axis) |
| Core Concepts | Slope (m), Y-intercept (b), X-intercept, Isolating the variable |
| Slope-Intercept Form | y = mx + b |
| Standard Form | ax + by = c |
| Target Audience | Middle school students, high school freshers, and self-learners |
| Difficulty | Beginner |
| Reading Time | About 9 minutes |
What Is a Linear Equation?
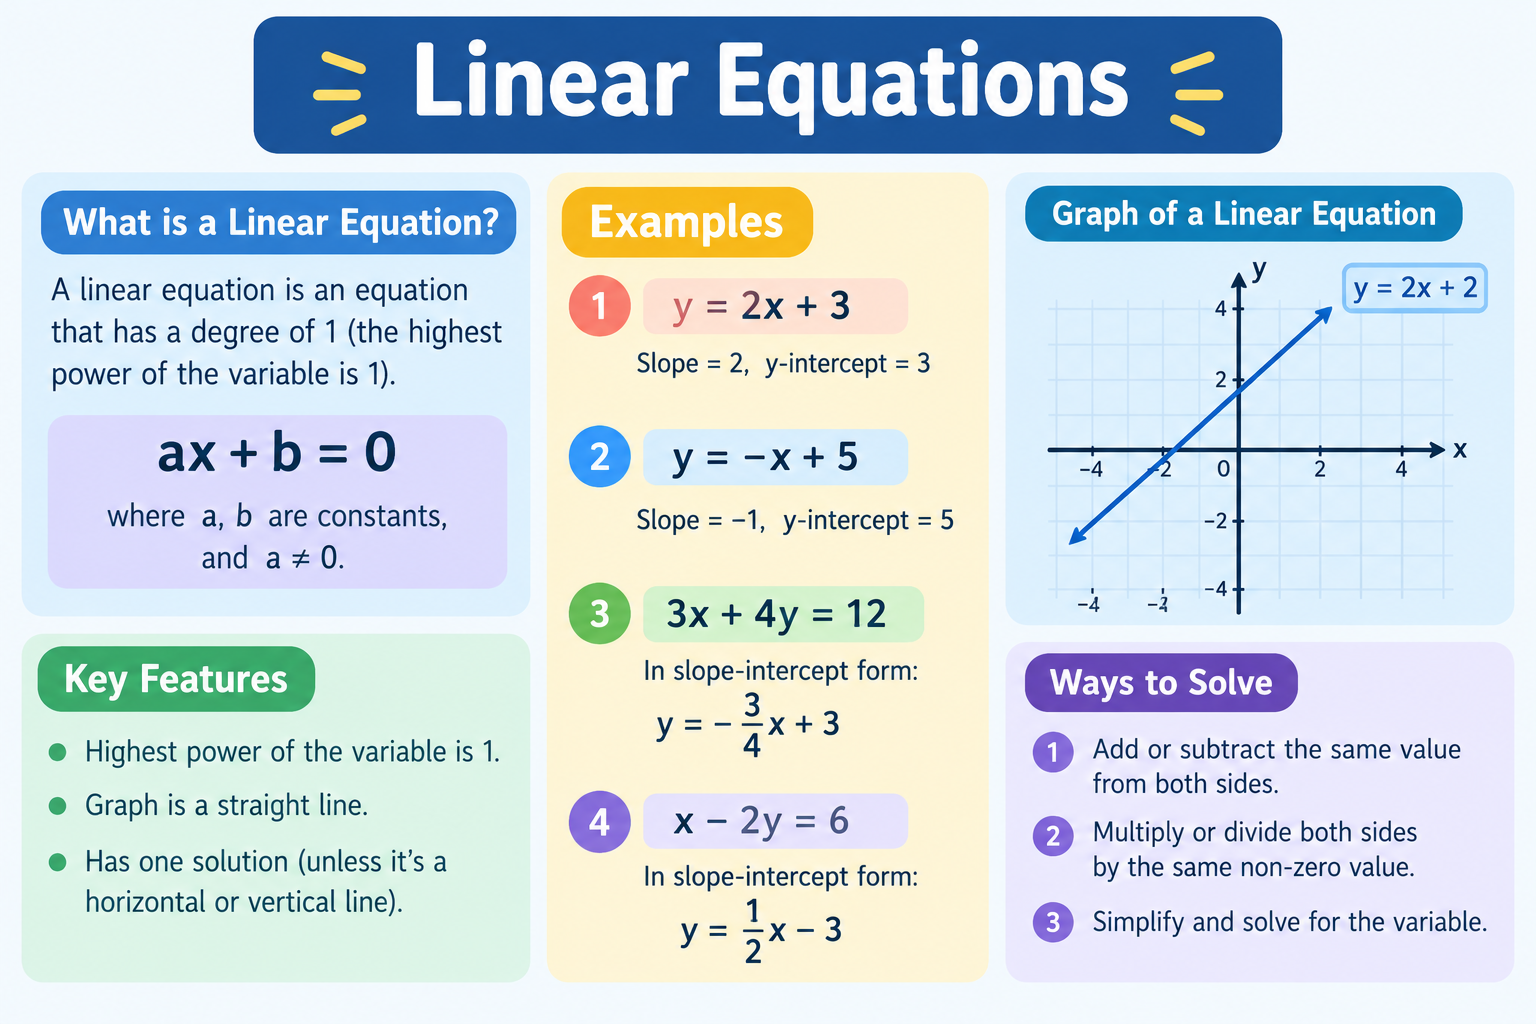
A linear equation is an equation whose graph is a straight line.
That’s the whole definition. Draw it on a grid, and you get a line. No curves. No bends. No zigzags.
What makes an equation “linear”? The variables only appear to the first power. You’ll see x, not x². You’ll see y, not y³. No variables get multiplied together, and none sit under a square root.
The Standard Form
One common way to write a linear equation is called standard form:
ax + by = cHere, a, b, and c are plain numbers. x and y are the variables.
Example: 2x + 3y = 12
This is a linear equation. Each variable is to the first power, and the terms are just added together.
Linear or Not? A Quick Check
| Equation | Linear? | Why |
|---|---|---|
y = 2x + 1 |
Yes | x is to the first power |
3x + 4y = 8 |
Yes | Standard form |
y = x² |
No | x is squared, so it makes a curve |
xy = 6 |
No | x and y are multiplied together |
y = 5 |
Yes | Makes a flat, horizontal line |
The Slope-Intercept Form: y = mx + b
This is the most famous formula in beginner algebra. Learn it well, and graphing gets much easier.
y = mx + bLet’s decode each piece.
- y is the vertical position of any point on the line.
- x is the horizontal position of that point.
- m is the slope.
- b is the y-intercept.
What Is the Slope (m)?
The slope tells you how steep the line is. It also tells you which way it tilts.
Think of it as “rise over run”:
m = rise / run = (change in y) / (change in x)- Rise is how far you move up or down.
- Run is how far you move left or right.
Here’s how to read it:
- Positive slope means the line climbs uphill from left to right.
- Negative slope means the line slides downhill.
- Zero slope means the line is perfectly flat.
- Large numbers (like 5) mean a very steep line.
- Small numbers (like 1/2) mean a gentle line.
Example: A slope of 3 means “rise 3, run 1.” For every step right, go up 3.
What Is the Y-Intercept (b)?
The y-intercept is the spot where your line crosses the y-axis. That’s the vertical line in the middle of your graph.
At that crossing point, x is always 0. So the y-intercept is always written as the point (0, b).
Example: In y = 2x + 5, the y-intercept is 5. The line crosses the y-axis at (0, 5).
Reading an Equation at a Glance
Take y = 4x − 2.
- Slope: m = 4
- Y-intercept: b = −2, so the point is (0, −2)
Just by reading the equation, you already know where to start and how to move. That’s the power of this form.
How to Solve Linear Equations
Solving means finding the value of the variable that makes the equation true.
Here’s the rule to tattoo on your brain: whatever you do to one side, do to the other. An equation is a balanced scale. Keep it balanced.
Your goal is to isolate the variable, which means getting it alone on one side.
Solved Example: 3x + 6 = 18
Step 1: Spot the extra number. There’s a + 6 attached to the 3x term.
Step 2: Undo it. Subtract 6 from both sides.
3x + 6 − 6 = 18 − 6
3x = 12
Step 3: Undo the multiplication. The variable is multiplied by 3. Divide both sides by 3.
3x ÷ 3 = 12 ÷ 3
x = 4
That final division gives you a clean quotient. If that word feels fuzzy, this simple explanation of what is a quotient in math will help it click.
Step 4: Check your work. Plug 4 back in.
3(4) + 6 = 12 + 6 = 18 ✓Final Answer: x = 4
Solved Example: 5x − 2 = 3
Step 1: Add 2 to both sides.
5x − 2 + 2 = 3 + 2
5x = 5
Step 2: Divide both sides by 5.
x = 1Final Answer: x = 1
Solved Example with a Fraction Answer: 4x + 1 = 4
Step 1: Subtract 1 from both sides.
4x = 3Step 2: Divide both sides by 4.
x = 3/4Don’t worry about the fraction. The numerator is smaller than the denominator, so it’s a proper fraction. If you’d like a refresher, check out this guide on what is a proper fraction.
Final Answer: x = 3/4
How to Graph a Linear Equation
Now for the visual part. There are two beginner-friendly methods.
First, a quick reminder about coordinates. Every point is written as (x, y). The x-value comes first. It tells you how far to move sideways. The y-value comes second. It tells you how far to move up or down.
If you want to see straight-line graphing in motion, the MathisFun Linear Equations Guide has simple interactive models you can play with.
Method 1: The Slope-Intercept Plotting Method
Use this when your equation is already in y = mx + b form.
Graph: y = 2x + 1
Step 1: Identify m and b.
- Slope m = 2, which is the same as 2/1
- Y-intercept b = 1
Step 2: Plot the y-intercept. Put a dot at (0, 1).
Step 3: Use the slope to find the next point. Rise 2, run 1. Start at (0, 1), go up 2, then right 1. You land on (1, 3).
Step 4: Repeat for a third point. From (1, 3), go up 2 and right 1 again. You land on (2, 5).
Step 5: Draw the line. Connect your dots with a ruler. Extend it in both directions and add arrows at the ends.
Here’s a handy table of points for this line:
| x | y = 2x + 1 | Point |
|---|---|---|
| 0 | 2(0) + 1 = 1 | (0, 1) |
| 1 | 2(1) + 1 = 3 | (1, 3) |
| 2 | 2(2) + 1 = 5 | (2, 5) |
| −1 | 2(−1) + 1 = −1 | (−1, −1) |
A tip for bigger graphs. When the numbers get large, choose x-values that are multiples of a convenient number to keep your points on clean grid lines. That’s the same idea behind what is a multiple in math, and it makes scaling a grid much easier.
What If the Slope Is a Fraction?
Take y = (1/2)x + 3.
A slope of 1/2 means “rise 1, run 2.” Start at (0, 3). Go up 1 and right 2. You land on (2, 4).
Fractional slopes just give you gentler lines. Slopes like 1/2 or 3/4 are proper fractions, so the line rises less than it runs.
Method 2: The Intercept Method
Use this when your equation is in standard form, like ax + by = c.
The idea is simple. Find where the line crosses each axis. Then connect the two points.
Graph: 2x + 3y = 12
Step 1: Find the x-intercept. Set y = 0 and solve.
2x + 3(0) = 12
2x = 12
x = 6
The x-intercept is (6, 0).
Step 2: Find the y-intercept. Set x = 0 and solve.
2(0) + 3y = 12
3y = 12
y = 4
The y-intercept is (0, 4).
Step 3: Plot both points. Mark (6, 0) and (0, 4) on the grid.
Step 4: Connect them. Draw a straight line through both points and extend it.
Step 5: Double-check with a third point. Try x = 3.
2(3) + 3y = 12
6 + 3y = 12
3y = 6
y = 2
The point (3, 2) should sit right on your line. It does.
Converting Standard Form to Slope-Intercept Form
Sometimes you want y = mx + b instead. Just solve for y.
Convert: 2x + 3y = 12
3y = −2x + 12
y = (−2/3)x + 4
Now you can read it directly. Slope is −2/3. Y-intercept is 4. Both methods match.
Which Method Should You Use?
| Situation | Best Method |
|---|---|
Equation looks like y = mx + b |
Slope-intercept plotting |
Equation looks like ax + by = c |
Intercept method |
| You want a quick sanity check | Table of values |
| Slope is a fraction | Slope-intercept plotting |
Common Mistakes to Avoid
Everyone slips up here at first. Knowing these traps ahead of time keeps you safe.
- Mixing up the axes. Remember: x is horizontal, y is vertical. Write points as (x, y), never (y, x).
- Using the wrong sign on the slope. A negative slope goes downhill. Double-check the sign before you plot.
- Applying operations unevenly. If you subtract 6 from the left, subtract 6 from the right. Always both sides.
- Flipping rise and run. Slope is rise over run, not run over rise. Up and down comes first.
- Forgetting to extend the line. A line goes on forever. Add arrows at both ends.
- Skipping the check. Substitute your answer back into the original equation. It takes seconds and catches most errors.
- Plotting the y-intercept at (b, 0). It’s (0, b). The x-value is zero at the y-axis.
Quick Practice Time
Try these before you peek at the answers.
Solve:
x + 8 = 152x − 5 = 96x + 3 = 21
Graph (list two points for each):
y = x + 2x + y = 5
Answers:
- x = 7
- x = 7
- x = 3
- Points such as (0, 2) and (1, 3)
- Intercepts (5, 0) and (0, 5)
Want more reps with instant feedback? The Khan Academy Graphing Linear Equations Practice section offers interactive coordinate plotting exercises that are great for building speed.
Final Thoughts
Linear equations feel tricky for about a week. Then they feel natural.
Keep these big ideas close:
- A linear equation makes a straight line.
- Standard form is
ax + by = c. - Slope-intercept form is
y = mx + b, where m is the slope and b is the y-intercept. - To solve, isolate the variable and keep both sides balanced.
- To graph, either plot the intercept and use the slope, or find both intercepts and connect them.
Practice a few problems each day. Draw the lines by hand. Say the steps out loud. Soon you’ll look at an equation and picture the line instantly.
That’s real algebra skill. And you’re well on your way.
📌 Educational Disclaimer
This guide is provided for general informational and academic learning purposes only. It is not a substitute for professional instruction, formal coursework, or personalized tutoring. While every effort has been made to ensure accuracy, learners are encouraged to verify results and consult a qualified teacher or official curriculum materials for specific academic or examination requirements.