

You scored 84 on a math quiz and 90 on a Spanish quiz. Which one was the better performance? The 90 looks bigger, but that’s only fair if both quizzes were equally hard and the class scores were spread out the same way. Usually they aren’t.
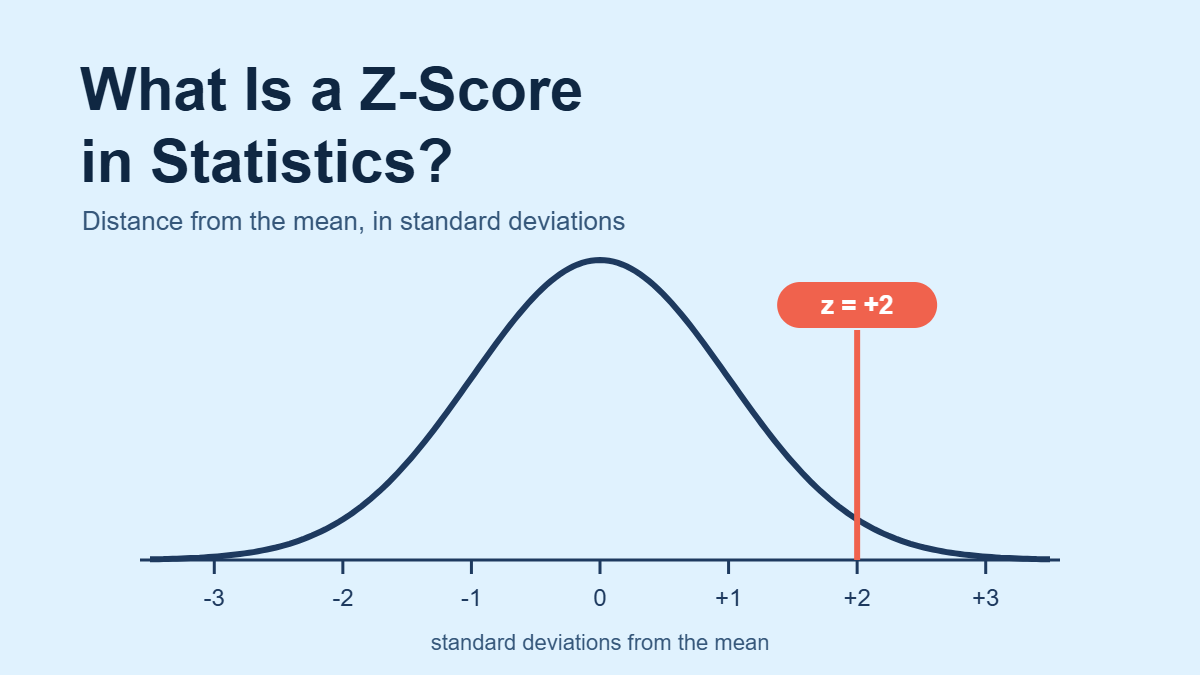
A z-score in statistics solves that problem. It tells you how many standard deviations a value sits above or below the mean of its group. Once two scores are turned into z-scores, they sit on the same scale, so you can compare them directly.
This guide covers the z-score formula, how to read positive and negative values, a worked comparison, how a z-score turns into a percentile, and a live chart where you can try it with real SAT data from the Class of 2025.
Quick Info
| Topic | Detail |
|---|---|
| Short definition | How many standard deviations a value is from the mean |
| Formula | z = (value minus mean) / standard deviation |
| Units | None: a z-score is a pure number, so unlike scales become comparable |
| z = 0 | The value equals the mean |
| Positive vs negative | Positive is above the mean, negative is below it |
| Common rule of thumb | Beyond plus or minus 3 is unusual and worth a closer look |
| Reading time | About 10 minutes |
What Is a Z-Score?
A z-score is the distance between a value and the mean, measured in standard deviations.
Penn State’s introductory statistics course describes it the same way: the distance between an individual score and the mean in standard deviation units, also called a standardized score.
Think of the standard deviation as a ruler made for one particular data set. A z-score just says how many of those rulers you’d lay end to end to get from the average to your value. A z-score of 2 means “two rulers above average.” A z-score of -0.5 means “half a ruler below.”
If the standard deviation itself feels fuzzy, our guide to standard deviation explains it from scratch, including the 68-95-99.7 rule for bell-shaped data.
How to Read a Z-Score at a Glance
| Z-score | What it means | Roughly how unusual (bell-shaped data) |
|---|---|---|
| 0 | Exactly average | Half the values are above, half below |
| +1 or -1 | One standard deviation from the mean | About 68% of values fall between -1 and +1 |
| +2 or -2 | Two standard deviations away | About 95% fall between -2 and +2 |
| +3 or -3 | Three standard deviations away | About 99.7% fall between -3 and +3 |
| Beyond +3 or -3 | Very far from typical | Rare: worth checking for errors or special causes |
The Z-Score Formula
For a whole population:
z = (x - mu) / sigmaFor a sample:
z = (x - x-bar) / s- x is the value you’re checking.
- mu (or x-bar) is the mean of the population (or of your sample).
- sigma (or s) is the standard deviation.
The top half of the fraction asks “how far from average?” The bottom half asks “how big is a typical step in this data?” Dividing one by the other cancels the units, which is why a z-score has none.
Worked Example: Math Quiz vs Spanish Quiz
Priya took two quizzes in the same week. (The figures are illustrative.)
| Quiz | Priya’s score | Class mean | Class standard deviation |
|---|---|---|---|
| Math | 84 | 72 | 6 |
| Spanish | 90 | 85 | 10 |
Step 1: Find the Distance From the Mean
Math:    84 - 72 = 12 points above average
Spanish: 90 - 85 = 5 points above average
Step 2: Divide by the Standard Deviation
Math:    12 / 6  = 2.0
Spanish:  5 / 10 = 0.5
Step 3: Compare
Priya’s math score is 2 standard deviations above her class. Her Spanish score is only half a standard deviation above. The lower raw score was the far more impressive result.
Step 4: Turn It Into Plain English
If scores in both classes are roughly bell-shaped, a z of 2.0 beats about 98% of the class, while a z of 0.5 beats about 69%. Same student, same week, and the “smaller” number hides the standout performance.
Real Example: Z-Scores on the SAT
The College Board’s 2025 SAT annual report for the total group lists a mean total score of 1029 and a standard deviation of 235 for the Class of 2025, based on 2,004,965 test-takers. Those two numbers are all you need to turn any SAT score into a z-score.
| SAT total score | Calculation | Z-score | Rough percentile (normal curve) |
|---|---|---|---|
| 800 | (800 – 1029) / 235 | -0.97 | About 16th |
| 1029 | (1029 – 1029) / 235 | 0.00 | 50th |
| 1300 | (1300 – 1029) / 235 | 1.15 | About 88th |
| 1600 | (1600 – 1029) / 235 | 2.43 | About 99th |
Drag the slider to any SAT score and watch the z-score and the shaded share of test-takers change. Switch to “My own data” to check any value, mean and standard deviation, like Priya’s quiz scores.
A 1300 sits a little more than one standard deviation above the national average. On a normal curve, that’s higher than roughly 88% of test-takers.
One honest caveat: the percentiles here come from treating SAT scores as a perfect bell curve. Real scores are capped at 400 and 1600 and aren’t perfectly normal, so the College Board’s own percentile tables can differ by a few points. Use z-scores to see how far from average a score is, and the official tables when you need an exact rank.
From Z-Score to Percentile
For bell-shaped data, every z-score matches a percentile:
| Z-score | Percentile (approximate) |
|---|---|
| -2 | 2nd |
| -1 | 16th |
| 0 | 50th |
| +1 | 84th |
| +2 | 98th |
| +3 | 99.9th |
That’s the bridge between z-scores and percentiles. A z-score tells you distance in standard deviations, and the percentile tells you what share of the group is below you.
Using Z-Scores to Spot Outliers
Because a z-score measures distance from typical, it doubles as an outlier detector. A common rule is to take a closer look at anything beyond plus or minus 3.
Say a coffee shop’s daily sales average $1,800 with a standard deviation of $150 (illustrative). One Saturday it takes in $2,400:
z = (2,400 - 1,800) / 150 = 4.0A z of 4 is far outside the normal day-to-day swing. Maybe a local event brought a crowd, or maybe a refund was keyed in as a sale. Either way, it deserves a look before it goes into next month’s forecast.
Z-scores have one weakness here. The extreme value itself pulls the mean and stretches the standard deviation, which can hide it, especially in small data sets. If your data is lopsided or has several extreme values, the IQR fence method from our quartiles guide is usually the safer check.
Where You’ll Meet Z-Scores
- Test scores: standardized tests and IQ scales report how far a score sits from the average test-taker.
- Children’s growth: pediatric growth tools often express height or weight as a z-score against a reference population.
- Quality control: factories flag parts whose measurements land too many standard deviations from the target.
- Research: inferential statistics uses z-values to decide whether a result is too far from “no effect” to be chance, such as the familiar 1.96 cutoff for 95% confidence.
Common Z-Score Mistakes
| Mistake | Reality |
|---|---|
| “A negative z-score is bad” | It only means below average. For race times, costs or errors, below average is good |
| “z = 2 means twice the average” | It means two standard deviations above the average, which is a very different thing |
| Mixing up population and sample formulas | Use mu and sigma for a full population, x-bar and s for a sample |
| Reading every z-score as a percentile | The z-to-percentile table only works for roughly bell-shaped data |
| Comparing z-scores from very different groups | A z of 1 against elite athletes and a z of 1 against beginners describe very different people |
| Deleting anything beyond z = 3 | Investigate first; some extreme values are the real story |
Frequently Asked Questions
What does a z-score of 0 mean?
A z-score of 0 means the value equals the mean exactly. It’s perfectly average for that group. On a bell-shaped distribution, half the values sit above it and half below, so it lines up with the 50th percentile, which is also the median when the data is symmetric.
Can a z-score be negative?
Yes. A negative z-score means the value is below the mean. A z of -1.5 is one and a half standard deviations under average. Negative isn’t a judgment: in golf, race times or monthly expenses, a negative z-score is often the result you want.
What is a good z-score?
There’s no universal good score, because it depends on whether higher or lower is better. For test scores, anything above +1 beats roughly 84% of a bell-shaped group, and above +2 beats about 98%. For waiting times or error rates, you’d want a negative z-score.
How do you convert a z-score to a percentile?
For bell-shaped data, look the z-score up in a standard normal table, or use a spreadsheet function like NORM.S.DIST(z, TRUE) in Excel, which returns the share of values below it. Multiply by 100 for the percentile. A z of 1.15, for example, gives about 0.875, or roughly the 88th percentile.
Is a z-score the same as a standard score?
Yes. “Standard score” and “standardized score” are other names for the z-score. Some fields rescale z-scores into other standard scores, like T-scores (mean 50, standard deviation 10), but the idea of measuring distance in standard deviations stays the same.
Do z-scores only work for normal distributions?
You can calculate a z-score for any data that has a mean and standard deviation. What changes is the interpretation: the neat links to percentiles (z = 2 is about the 98th percentile) only hold when the data is roughly bell-shaped. For skewed data, use the z-score as a distance, not as a percentile.
Conclusion
A z-score tells you how many standard deviations a value sits from the mean. It strips away units, so a math quiz and a Spanish quiz, or this year’s SAT and a coffee shop’s sales, can be judged on the same scale. Positive means above average, negative means below, and anything past plus or minus 3 is rare enough to check twice.
Next time someone hands you a raw score, ask the z-score question: compared with the usual spread, how far from average is it really?
References
- Penn State Eberly College of Science, STAT 200, “2.2.8 – z-scores.”
- College Board, “SAT Suite of Assessments Annual Report: Total Group, 2025.”
Disclaimer
This article is for general educational purposes only. The quiz scores and coffee shop sales are illustrative, and the SAT percentiles shown are normal-curve approximations rather than official College Board percentiles. For admissions decisions, use the official score reports.