

Introduction
A chai seller does not need to drink an entire pot to check whether it is ready. A small sip can provide a useful clue. In statistics, that small portion is similar to a sample: a smaller group selected from a larger group so researchers can learn about the whole without measuring every member.
A sample is useful only when it is chosen and studied carefully. This guide explains what a sample is, what sample size means, what makes a sample useful, and how samples are used in everyday research. It also explains the difference between sampling error and bias.
Quick Info
| Topic | Detail |
| Definition | A subset selected from a population and measured to learn about that population. |
| Sample-size symbol | n (lowercase) |
| Sample result | A statistic, such as the sample mean (x̄). |
| Good sample | Suitable for the research question, selected carefully, and measured accurately. |
| Main trade-off | Larger samples can improve precision but usually require more time and money. |
| Important limitation | A large sample does not automatically remove bias. |
What Is a Sample in Statistics?
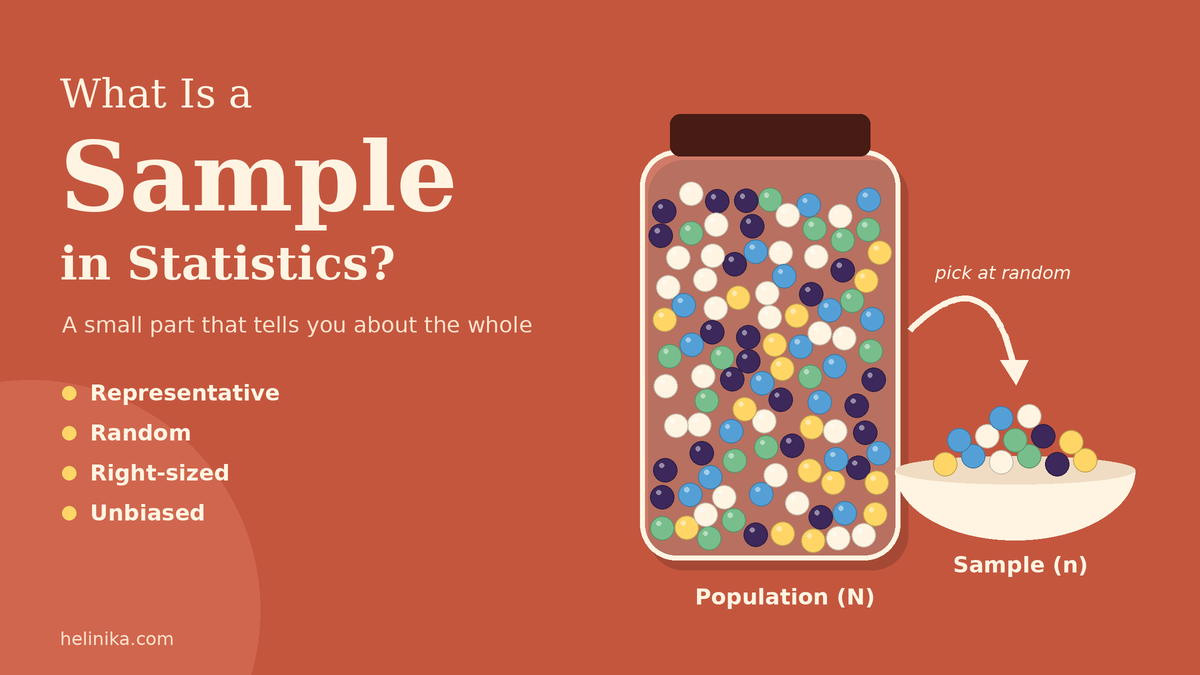
A sample is a subset of people, objects, events, or measurements selected from a larger population and studied to learn about that population.
The population is the complete group a researcher wants to understand; the sample is the part from which data are collected. A number calculated from sample data—such as an average or percentage—is called a statistic. Researchers may use that statistic to estimate a corresponding population value, known as a parameter.
For a broader introduction, read What Is Statistics?.
Key Terms at a Glance
| Term | Meaning | Example |
| Population | Complete group relevant to the question | All 1,200 students at a school |
| Sample | Members actually selected and measured | 120 selected students |
| Sample size (n) | Number of observations in the sample | n = 120 |
| Sampling unit | Individual unit selected | One student |
| Sample statistic | Summary calculated from sample data | 45% of sampled students use the bus |
| Population parameter | Numerical description of the whole population | Actual percentage of all students using the bus |
Why Do Researchers Use Samples?
Studying every member of a population is often too expensive, slow, difficult, or unnecessary. A carefully designed sample can provide useful information with fewer resources.
- Save time by collecting information from hundreds of people instead of millions.
- Reduce costs for interviews, tests, inspections, and laboratory measurements.
- Make destructive testing practical; a manufacturer cannot destroy every product to test it.
- Produce timely results when opinions, prices, or behaviour may change quickly.
- Allow researchers to spend more time checking each observation.
Sample Size: How Big Should a Sample Be?
Sample size is the number of observations included in a sample. It is represented by the lowercase letter n. If a researcher surveys 400 students, the sample size is n = 400.
Why Sample Size Matters
A sample result may differ from the value that would be found by measuring everyone. This difference due to observing a sample rather than the full population is called sampling error. The Australian Bureau of Statistics explains that increasing sample size generally reduces sampling error, although study design and population variability also matter.
Official reference: Australian Bureau of Statistics – Types of Error
A larger sample often improves precision when the sampling design is sound. However, improvement becomes smaller as the sample grows. Doubling the sample does not usually halve the margin of error.
The Four-Times Rule of Thumb
Under comparable conditions and a suitable probability-sampling design, multiplying the sample size by four can reduce the standard error by about half. This is an approximation, not a universal guarantee.
| Starting sample | Larger sample | Approximate effect |
| 100 | 400 | Standard error may be about half |
| 400 | 1,600 | About half again |
| 1,600 | 6,400 | About half again |
The Australian Bureau of Statistics explains that sample design, population variability, and sample size all affect sampling error.
ABS – Errors in Statistical Data
What Affects the Required Sample Size?
| Factor | Effect |
| Required precision | A smaller desired margin of error generally needs a larger sample. |
| Confidence level | A higher confidence level generally needs more observations, all else equal. |
| Population variability | More variation usually requires a larger sample. |
| Subgroup comparisons | Separate estimates for regions or age groups need enough observations in each group. |
| Budget and time | Available resources may limit collection. |
| Expected response rate | If many selected people may not reply, more people may need to be invited. |
For a large population, total population size often has less influence on required sample size than precision, confidence, variability, and study design. A poll of around 1,000 people can sometimes estimate a proportion in a very large population with useful precision, but the exact uncertainty depends on the sampling method, weighting, response patterns, and other design details.
Rough Sample-Size Examples
| Study type | Illustrative sample size |
| Classroom project or pilot survey | 30–100 |
| Customer feedback survey | 200–500 |
| Local opinion poll | 400–1,000 |
| National opinion poll | 1,000–3,000 |
| Large government household survey | Thousands or tens of thousands |
These are examples, not recommended minimums. A study should justify its sample size using its objective, design, expected variability, and required precision.
Bigger Does Not Automatically Mean Better
A large sample can still produce a misleading result if the wrong people are included or if responses are systematically missing. An online poll on a news website may receive thousands of votes but fail to represent the wider public because visitors choose whether to take part. Sample size can reduce random sampling error; it does not automatically remove selection bias, non-response bias, or measurement problems.
Characteristics of a Useful Sample
1. Appropriate representation
The sample should reflect important characteristics of the population for the question being studied. If age or location affects the result, those groups should not be unintentionally left out.
2. A suitable selection method
Probability sampling is valuable in many studies because each population unit has a known chance of selection. Random selection can reduce selection bias, but it does not guarantee that every sample perfectly matches the population.
3. Adequate size
The sample should be large enough for the precision and subgroup analysis required. An unnecessarily large sample can waste resources.
4. Low risk of bias
The selection process, contact method, questions, and data handling should not systematically push results in one direction.
5. Appropriate independence
Many statistical methods assume observations are independent. If people are sampled in groups, such as classrooms or households, the analysis may need to account for that clustered design.
6. A clearly defined population
Researchers should state exactly who or what the conclusions are intended to describe.
7. Ethical and practical collection
Participants should be treated respectfully, privacy should be protected, and the study should be feasible within its time and budget.
Good Sample vs Poor Sample
| Feature | More defensible sample | Potentially poor sample |
| Who is included | Covers relevant population groups | Only easy-to-reach or like-minded people |
| How selected | Uses a method suited to the question | Relies only on convenience or voluntary responses |
| Size | Justified by the study’s needs | Too small for intended analysis, or unnecessarily large |
| Interpretation | Claims are limited to the population the design supports | Results are generalised far beyond the people represented |
| Example | Households selected across a city using a defined plan | Replies to an open poll on one news website |
Examples of Samples in Real Life
| Situation | The sample | What is measured |
| TV audience research | Selected households or viewers | Which programmes people watch |
| Election opinion poll | Eligible voters selected for a survey | Voting intention at the time of the poll |
| Medical study | Eligible volunteers or patients enrolled under a protocol | Changes in health outcomes |
| Factory quality check | Products selected from a production run | Whether products meet standards |
| River-water monitoring | Water collected at selected locations and times | Pollutant levels or water quality |
| Restaurant feedback | Customers who complete a survey | Reported satisfaction |
| Crop survey | Selected plots from farms or fields | Crop yield per plot |
Restaurant feedback needs particular care: customers who choose to submit a card may have stronger opinions than customers who do not respond. The results may therefore be affected by voluntary-response or non-response bias.
Worked Example: A Juice Factory
A factory fills 10,000 juice cartons during an eight-hour shift. Each carton should contain 250 ml. The quality team selects five cartons at random every hour, giving a daily sample of 40 cartons (n = 40).
| Inspection result | Number of cartons |
| Within the allowed range (245–255 ml) | 38 |
| Under-filled | 2 |
| Total sample | 40 |
The sample’s under-filled proportion is 2 ÷ 40 = 0.05, or 5%. The team can use 5% as an estimate of the proportion of under-filled cartons in the production run, provided the selection process is appropriate. It should not claim that exactly 500 cartons were under-filled: the sample result is an estimate and has uncertainty.
Worked Example: A School Survey
A principal wants to estimate how 1,200 students travel to school. She selects 120 students from the admission register using a suitable random method. The sample is 10% of the school’s enrolment.
| Travel method | Students in sample | Share of sample |
| School van or bus | 54 | 45% |
| Walk | 30 | 25% |
| Motorbike or car with family | 27 | 22.5% |
| Bicycle | 9 | 7.5% |
| Total | 120 | 100% |
In this sample, 45% use a school van or bus. The principal may estimate that roughly 45% of all 1,200 students—about 540 students—use those options. This is not an exact count; reliability depends on how students were selected and whether the sample represents the school.
Figure 1. A sample is a selected subset of a larger population.
Figure 2. Sample data are used to estimate population characteristics.
Population vs Sample
The population is the complete group the research question is about. The sample is the subset from which the researcher collects data.
| Feature | Population | Sample |
| Meaning | The whole group of interest | The selected part that is measured |
| Size symbol | N | n |
| Numerical descriptions | Parameters | Statistics |
| Result | Exact if every member is measured accurately | An estimate with uncertainty |
Related reading: What Is a Mean in Statistics? explains the sample mean and population mean.
For data variability, see the guide to standard deviation.
The Same Group Can Be a Population or a Sample
Whether a group is a population or a sample depends on the research question. If a researcher wants the average height of the 40 students in one specific class, those 40 students are the population of interest. If the question is about all Grade 9 students in a city, the same 40 students are only a sample—and may not represent the city.
How Is a Sample Different From a Census?
A census attempts to collect information from every member of the defined population. A sample study collects information from only part of it. A census avoids sampling error because it does not use a sample, but it can still contain other errors, such as missing responses, inaccurate answers, or data-processing mistakes.
Further reading: Penn State – Samples and Populations
Sampling Error, Bias, and Margin of Error
Sampling Error
Sampling error is the natural difference between a statistic calculated from a sample and the corresponding population value. It occurs because only part of the population is observed. For probability samples, researchers can estimate sampling uncertainty using methods appropriate to the design.
Bias and Non-Sampling Error
Bias is a systematic problem that pushes results away from the truth. It can arise when some groups are under-covered, people with certain opinions are more likely to respond, survey questions lead respondents, or measurements are recorded incorrectly. Increasing sample size does not necessarily fix these problems. The Australian Bureau of Statistics identifies non-sampling errors such as coverage, non-response, response, interviewer, and processing errors.
Official explanation: ABS – Types of Error
Margin of Error
A margin of error communicates part of the uncertainty around a sample estimate. For example, a poll result of 45% with a margin of error of ±3 percentage points may be reported as an interval from 42% to 48%, under the stated confidence level and survey assumptions. A margin of error does not capture every possible source of bias or error.
See also: U.S. Census Bureau – What Is the Margin of Error?
Common Mistakes When Using Samples
- Treating a sample result as an exact population fact. A sample percentage is an estimate, not automatically the true percentage.
- Assuming a large sample is always representative. A large convenience sample can still be biased.
- Using only the easiest people to contact. Friends, followers, and passers-by may not represent the target population.
- Assuming random selection guarantees a perfect match. Random sampling reduces certain selection problems, but chance variation remains.
- Ignoring people who do not respond. Non-respondents may differ from respondents in ways that affect the result.
- Generalising beyond the study population. A sample of students at one university does not automatically represent all young adults in a country.
- Confusing sampling error with all survey error. Poor questions, inaccurate measurements, and data-entry mistakes are separate concerns.
Frequently Asked Questions
What is a sample in statistics in simple words?
A sample is a smaller group selected from a larger group so researchers can study it and learn about the larger group.
What does n mean in statistics?
Lowercase n usually represents the number of observations in a sample. Uppercase N is commonly used for population size.
What makes a sample representative?
A representative sample reflects the population’s important characteristics for the research question. A suitable selection method and good coverage help, but no sample is guaranteed to match perfectly.
Is a bigger sample always better?
Not always. A larger, well-selected sample can improve precision, but a large biased sample can still produce misleading results.
What is sampling error?
It is the difference between a sample-based estimate and the corresponding population value that arises because only a sample was observed.
Can a sample give the exact population value?
A sample statistic can match the population parameter by chance. However, researchers generally cannot know it is exact without measuring the full population.
What is the difference between a sample and a population?
A population is the entire group a study aims to understand. A sample is the subset from which data are collected.
Conclusion
A sample is the part of a population that a researcher actually measures. Samples make research more practical, but their usefulness depends on how they are selected, how large they are for the question, and how carefully the data are collected. A larger sample can improve precision, yet it cannot automatically remove bias or other errors.
Define the population clearly, choose a sampling method that fits the research question, report uncertainty honestly, and avoid making claims beyond what the sample can support.
References
- Australian Bureau of Statistics – Types of Error
- Australian Bureau of Statistics – Errors in Statistical Data
- S. Census Bureau – What Is the Margin of Error?
- Penn State – Samples and Populations
Disclaimer
This article is for general educational purposes. Sample sizes and numerical examples are illustrative, not universal recommendations. Actual sample-size calculations depend on study design, desired precision, confidence level, population variability, response rate, and analysis plan. For academic work, follow the definitions and methods required by your course or instructor.