

Introduction
Imagine you want to find out what two million university students think about online classes. You cannot realistically ask every student, so you select a smaller group. But which students should you ask—students at one campus, people who answer an Instagram poll, or students selected at random from university records? Each approach can produce a different result.
The process used to choose that group is called sampling. A population is the whole group and a sample is the part you measure. This guide explains the process connecting them, the main sampling methods, and when each method may be useful.
Quick Info
| Topic | Detail |
| Definition | Process of selecting units from a population to form a sample. |
| Key tool | Sampling frame: list or source used to select units. |
| Main families | Probability and non-probability sampling. |
| Probability methods | Simple random, systematic, stratified, cluster, multi-stage. |
| Non-probability methods | Convenience, volunteer, judgement, quota, snowball. |
| Key principle | Use probability sampling when population-level estimates and measurable sampling uncertainty are required, if a suitable frame is available. |
What Is Sampling in Statistics?
Sampling is the process of selecting a subset of people, objects, events, or other units from a population so that the selected units can be studied.
The sample is the group selected; sampling is the method used to select it. Two researchers studying the same population may obtain different samples—and different results—because they use different methods.
Related guides: What Is a Sample in Statistics? | What Is a Population in Statistics?
The Two Goals of Good Sampling
- Representation: include the population in a way that supports the research question and intended conclusions.
- Measurable reliability: probability designs with known selection chances allow researchers to estimate sampling uncertainty.
No method guarantees a perfect miniature of the population. The right choice depends on the research objective, available frame, population, and practical constraints.
The Sampling Process: Step by Step
Many studies follow six broad steps. Consider a city health department estimating how many households have at least one child aged 0–5 who is fully vaccinated.
Step 1: Define the target population
State exactly who or what the results should describe. Here, it is households within the city limits in 2026 that have at least one child aged 0–5.
Step 2: Build or identify a sampling frame
A sampling frame is the list, register, map, or other source from which units are selected. Examples include household registers, school lists, business directories, or city-block maps. An incomplete frame may exclude some members; clinic records, for example, may miss families who never visit a clinic.
Step 3: Choose a sampling method
Decide whether probability or non-probability sampling fits the objective. Both are explained below.
Step 4: Determine sample size
Consider required precision, population variability, subgroup comparisons, likely non-response, budget, and sampling design. There is no universal sample size.
Step 5: Select units and collect data
Apply the method to the frame, select units, contact them, and collect data through interviews, questionnaires, measurements, or tests. Record refusals and people who cannot be reached.
Step 6: Evaluate the achieved sample
Check coverage, response patterns, and relevant characteristics. Weighting or further collection may sometimes help, but neither automatically removes bias.
Sampling Frame: Why It Matters
| Population | Possible frame | Possible coverage gap |
| Households in a city | Electricity connection records | Shared meters or households without a recorded connection |
| Students in a province | School enrolment lists | Children not enrolled in school |
| Small businesses | Tax registration records | Unregistered businesses |
| Mobile phone users | One network’s subscriber list | Users of other networks |
A sampling frame is not necessarily identical to the target population. Researchers should identify who may be missing and consider how that gap could affect results.
Probability Sampling
In probability sampling, units are selected using a random process and each unit in the target population has a known, non-zero chance of selection. Known probabilities make it possible to calculate sampling uncertainty and make appropriately designed estimates about the target population.
Official guide: Australian Bureau of Statistics – Sample Design
Probability sampling often requires a suitable sampling frame and can cost more to organise.
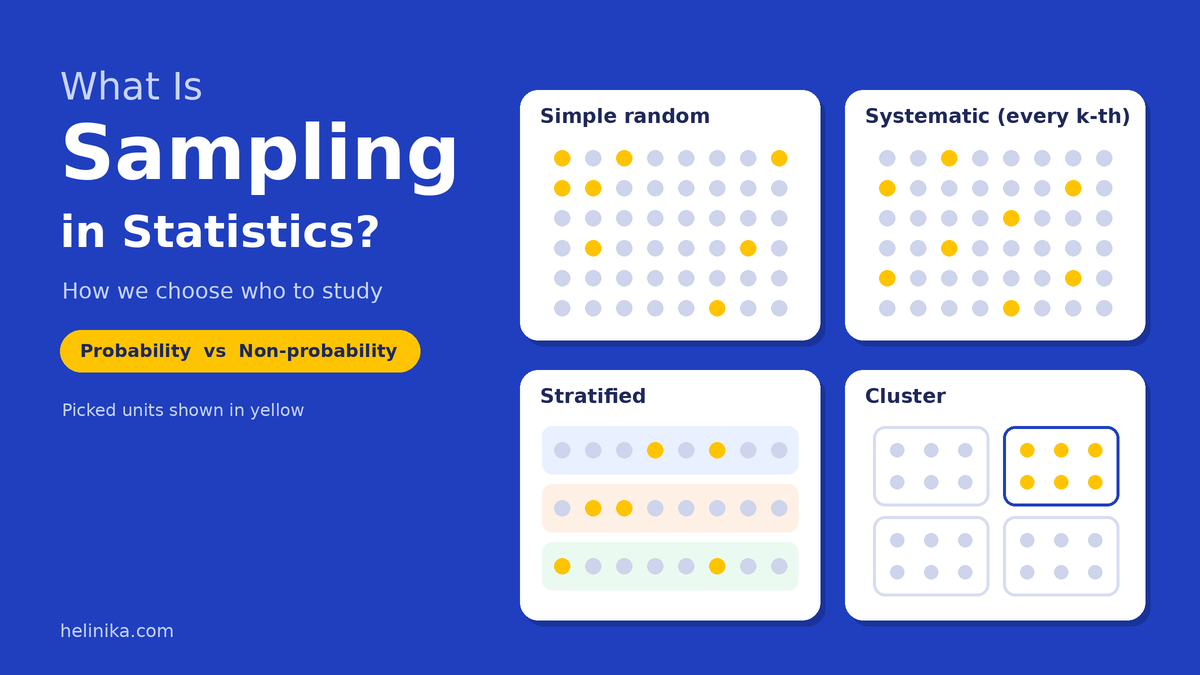
1. Simple Random Sampling
Every unit has an equal chance of selection. Researchers number units on a complete list and use a random-number generator. Example: randomly select 60 students from a school register of 1,200.
2. Systematic Sampling
Choose a random starting point, then select every k-th unit from an ordered list. A common interval is k = N ÷ n. Example: from 80,000 customers, a sample of 2,000 gives k = 40. Choose a random start from 1 to 40, then select every 40th record. Check for repeating patterns that align with the interval.
3. Stratified Sampling
Divide the population into relevant subgroups called strata, then select a sample from each. Example: a school has 720 girls and 480 boys. A proportional sample of 60 includes 36 girls and 24 boys. This helps ensure important groups are included.
4. Cluster Sampling
Divide the population into natural groups such as city blocks, villages, or schools. Randomly select some clusters, then study all units within selected clusters in a one-stage design. It can reduce travel costs, but people in a cluster may be similar, reducing precision.
5. Multi-Stage Sampling
Select units in two or more successive stages. For example, randomly select districts, then villages or urban blocks, then households. This is useful when one complete list of all population units is impractical.
Stratified vs Cluster Sampling
| Feature | Stratified | Cluster |
| Groups | Subgroups based on relevant characteristics | Natural or practical groups, often geographic |
| What is selected | Some units from every stratum | Some clusters; all units or a subsample within them |
| Main purpose | Subgroup coverage and potentially better precision | Reduce listing, travel, and fieldwork costs |
| Example | Randomly sample students from every grade | Select several schools, then survey students there |
Non-Probability Sampling
In non-probability sampling, units are selected through convenience, judgement, referrals, quotas, or self-selection rather than random selection with known probabilities. These methods can be faster and less expensive and may help with exploratory work or hard-to-reach groups. However, researchers generally cannot calculate conventional design-based sampling error or safely assume the results represent the entire population.
Reference: Statistics Canada – Non-Probability Sampling
1. Convenience Sampling
Select people who are easiest to reach, such as shoppers outside a mall or students in one class. Their views may differ from the wider population.
2. Volunteer (Self-Selected) Sampling
People decide whether to participate, such as by answering an online poll. People with strong opinions may be more likely to respond.
3. Judgement (Purposive) Sampling
A researcher deliberately selects people considered especially knowledgeable. Five experienced teachers in a focus group may provide useful exploratory insight, but not a random estimate of all teachers’ views.
4. Quota Sampling
Researchers set target numbers for categories and recruit until each quota is filled. Interviewer choice within each quota may introduce bias; matching group totals does not automatically make the sample representative.
5. Snowball Sampling
Participants refer other people who meet the study criteria. It can help reach rare or hidden groups, but people outside those networks may be missed.
When Can Non-Probability Sampling Be Useful?
- Early exploratory research before a larger study is designed.
- Testing a questionnaire or research procedure.
- Reaching rare or hidden groups when no complete list exists.
- Small qualitative studies where statistical generalisation is not the objective.
State the limitation clearly: findings primarily describe the people studied. Do not present a non-probability sample as automatically representative of the full population.
Probability vs Non-Probability Sampling
| Feature | Probability | Non-probability |
| Selection | Random process | Convenience, judgement, referral, quota, or self-selection |
| Selection chances | Known and non-zero | Unknown |
| Sampling frame | Usually needed | May not be needed |
| Sampling uncertainty | Can be estimated with suitable methods | Conventional design-based sampling error generally cannot be calculated |
| Cost and speed | Often costlier and slower | Often cheaper and faster |
| Population inference | Supported when design and implementation are appropriate | Requires strong assumptions; generalisation is limited |
| Methods | Simple random, systematic, stratified, cluster, multi-stage | Convenience, volunteer, judgement, quota, snowball |
How to Choose a Sampling Method
- Do findings need to estimate results for the whole population? Consider probability sampling where feasible.
- Is there a complete or sufficiently accurate list? Simple random or systematic sampling may be practical.
- Must important subgroups be represented? Consider stratified sampling.
- Is the population spread over a large area? Cluster or multi-stage sampling may reduce fieldwork costs.
- Is the group rare or hard to identify, with no list? Snowball or purposive methods may help, but conclusions should be limited.
- Is the project a pilot or exploratory study? Convenience or judgement sampling may be appropriate.
Worked Examples
Example 1: A National Literacy Survey
A government wants to estimate adult literacy across a country, but no single list of all adults exists. A possible design is multi-stage probability sampling, stratified by province: randomly select districts, then villages or urban blocks, then households and eligible adults. The design can cover different provinces while keeping fieldwork manageable. The analysis must account for selection at each stage, non-response, and weighting.
Example 2: A Mobile Phone Brand’s Customer Survey
A company has 80,000 customer records and wants to invite 2,000. A systematic design could use an interval of 40 after a random start. The company should check how the database is ordered because periodic patterns could affect selection.
Example 3: A Study of Home-Based Artisans
A researcher wants to understand home-based embroidery workers, but no official list exists. Snowball sampling through community organisations may help recruit participants. Findings should describe the recruited network, not all home-based workers.
Example 4: A Breakfast Television Poll
A morning show asks viewers to text YES or NO about later school start times. Twelve thousand texts arrive and 81% say YES. This is a volunteer sample. A large number of replies does not make it a random sample of the public.
Common Sampling Mistakes
- Defining the population vaguely, so it is unclear who findings apply to.
- Using an incomplete frame without explaining who may be excluded.
- Calling a volunteer or convenience poll a random sample.
- Assuming a large sample automatically removes bias.
- Confusing stratified sampling with cluster sampling.
- Ignoring refusals and people who could not be contacted.
- Generalising beyond the population and design actually studied.
Frequently Asked Questions
What is sampling in simple words?
Sampling is choosing which members of a larger group to study so researchers can learn about that group without asking everyone.
What is the difference between sampling and a sample?
Sampling is the selection process. The sample is the group selected.
What is a sampling frame?
A list, register, map, or other source from which units are selected.
What are the two main types of sampling?
Probability sampling uses random selection with known chances; non-probability sampling does not.
Which sampling method is best?
There is no single best method. It depends on the research question, population, frame, required precision, and resources.
Is quota sampling the same as stratified sampling?
No. Stratified sampling selects units randomly within each stratum; quota sampling does not necessarily use random selection within each quota.
Conclusion
Sampling connects a population to the sample a researcher studies. A sound plan defines the target population, identifies a suitable frame, chooses a method, determines sample size, selects units, collects data, and evaluates the achieved sample.
Probability sampling uses random selection and known selection probabilities, which can support population-level estimates and measurable sampling uncertainty. Non-probability sampling can be faster and useful for exploratory or hard-to-reach research, but findings should not automatically be generalised to the whole population. Choose the method that fits the question and be transparent about its limitations.
References
- Australian Bureau of Statistics – Basic Survey Design: Sample Design
- Statistics Canada – Non-Probability Sampling
- Statistics Canada – Questions to Ask About Surveys
Disclaimer
This article is for general educational purposes. Examples are illustrative and do not replace a formal survey design. Real studies may combine sampling methods, use weighting, and account for non-response and complex designs. For high-stakes research, consult a qualified survey statistician.