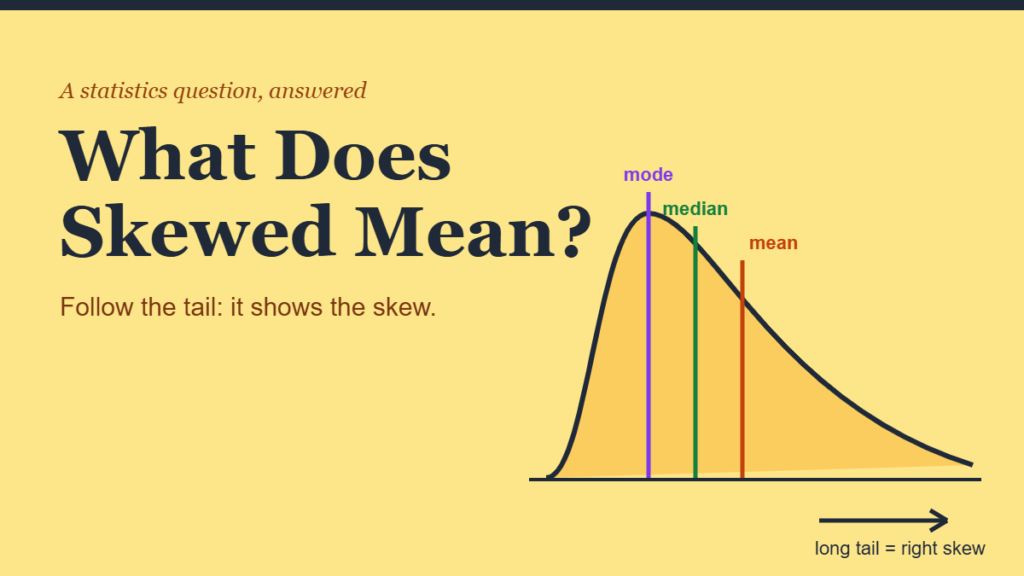
Ask ten coworkers how many books they read last year and you might hear 2, 3, 4, 4, 4, 5, 5, 6, 7 and 30. Nine answers huddle together. One avid reader sits far out on their own. Average them and you get 7 books, a number that describes almost nobody in the group. That lopsided pattern is what statisticians mean by skewed data.
The short skewed meaning: a set of data is skewed when it isn’t symmetric, so one side stretches out into a long tail while most values bunch up on the other side. The tail drags the mean toward it, which is why the “average” can mislead you.
This guide explains what skewed means in plain words, how to spot it on a chart, how the mean, median and mode react, two simple ways to measure skewness, and what to do when your data is lopsided.
Quick Info
| Topic | Detail |
|---|---|
| Short definition | Data is skewed when one tail of the distribution is longer than the other |
| Direction rule | The skew is named after the side with the long tail |
| Right (positive) skew | Long tail to the right; mean usually above the median |
| Left (negative) skew | Long tail to the left; mean usually below the median |
| Symmetric data | Skewness close to 0; mean and median about equal |
| Best summary for skewed data | Median and interquartile range |
| Reading time | About 10 minutes |
What Does Skewed Mean?
In statistics, skewed means a distribution is lopsided: the values are not mirrored around the center, and one side trails off into a longer tail than the other.
In everyday English, “skewed” often means distorted or biased, as in “the survey results were skewed.” The statistical meaning is narrower. Skewed data isn’t wrong or broken. It simply has a shape that isn’t balanced.
The U.S. National Institute of Standards and Technology (NIST) describes skewness as “a measure of symmetry, or more precisely, the lack of symmetry.” A perfectly symmetric shape, like the classic bell curve, has a skewness of zero.
NIST/SEMATECH e-Handbook of Statistical Methods: Measures of Skewness and Kurtosis
The tail rule
Here’s the one idea that clears up most confusion: the skew points toward the tail, not toward the hump.
- If the long tail stretches to the right (toward bigger numbers), the data is right-skewed, also called positively skewed.
- If the long tail stretches to the left (toward smaller numbers), the data is left-skewed, also called negatively skewed.
Many students guess the opposite, because the tall part of the chart sits on the other side. Look for the tail instead, and you’ll name it correctly every time.
Skewed vs symmetric at a glance
| Shape | What the chart looks like | Mean vs median | Everyday example |
|---|---|---|---|
| Symmetric | Two matching halves | About equal | Adult heights within one group |
| Right-skewed | Hump on the left, long tail right | Mean > median | Household income, home prices |
| Left-skewed | Hump on the right, long tail left | Mean < median | Scores on an easy test |
How to Spot Skewed Data
You don’t need any formula to spot skew. Three quick checks usually tell the story.
1. Look at a histogram
A histogram groups values into bars. If the bars climb quickly on one side and then trickle off slowly on the other, you’re looking at skew. A frequency distribution table shows the same pattern in numbers: lots of counts in a few neighboring rows, and a handful of stragglers far away.
2. Compare the mean and the median
The mean uses every value’s size, so extreme values tug it toward the tail. The median only cares about the middle position, so it barely moves. A big gap between the two is a strong hint of skew.
3. Check the distance to each end
Compare how far the minimum and maximum sit from the median. In the book data, the median is 4.5, the minimum is 2.5 below it, and the maximum is 25.5 above it. That imbalance is skew you can see without a chart. Quartiles work the same way: if Q3 is much farther from the median than Q1, the upper half is stretched.
Worked Example: Books Read by Ten Coworkers
Let’s run the numbers on the reading data from the introduction. The figures are illustrative.
Data: 2, 3, 4, 4, 4, 5, 5, 6, 7, 30
Step 1: Find the mean
(2 + 3 + 4 + 4 + 4 + 5 + 5 + 6 + 7 + 30) ÷ 10 = 70 ÷ 10 = 7 books
Step 2: Find the median
With ten values, the median is the average of the 5th and 6th values: (4 + 5) ÷ 2 = 4.5 books.
Step 3: Find the mode
The value 4 appears three times, more than any other, so the mode is 4.
Step 4: Put them in order
Mode (4) < Median (4.5) < Mean (7)
This ordering is the classic signature of right skew. The mode sits at the peak, the median sits in the middle of the crowd, and the mean gets pulled out toward the long tail.
Step 5: See what one value does
Remove the reader who finished 30 books and recalculate. The mean drops from 7 to about 4.4, while the median only moves from 4.5 to 4. One value shifted the mean by more than 2.5 books. That’s why the median is the better “typical value” here.
Try It: Watch Skew Move the Mean, Median and Mode
Drag the slider to bend the distribution from left-skewed, through symmetric, to right-skewed. Watch the three center lines spread apart as the tail grows, and notice which one runs out toward the tail first.
Purple: mode (the peak). Green: median (half the area on each side). Orange: mean (the balance point). The further the tail stretches, the further the mean runs toward it.
How to Measure Skewness
Eyeballing works for a first look, but sometimes you need a number. Here are two common measures.
Pearson's second skewness coefficient
This quick version needs only the mean, median and standard deviation:
Skewness ≈ 3 × (Mean − Median) ÷ SD
- Mean − Median shows which way the tail pulls.
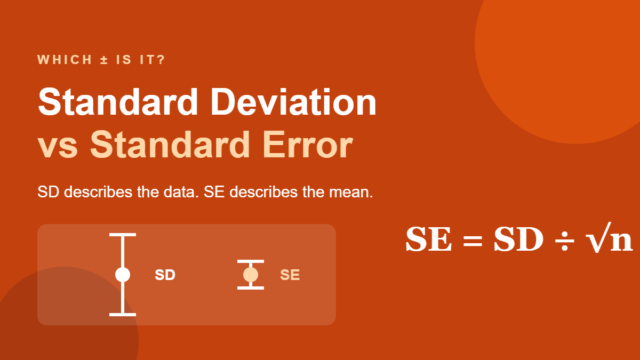
- SD is the standard deviation, which scales the gap so different datasets can be compared.
For the book data, the sample SD is about 8.21:
3 × (7 − 4.5) ÷ 8.21 ≈ 0.91
A positive result confirms right skew.
The moment coefficient of skewness
This is the measure most software reports (for example, Excel's SKEW function). It cubes each value's distance from the mean, so values far out in a tail count heavily, and cubes keep the sign, so left-tail values push the result negative. NIST notes that positive values indicate data skewed right and negative values indicate data skewed left.
For the book data, the sample skewness from this formula is about 2.99, a strong right skew. Without the 30-book reader, it falls to about 0.14, close to symmetric.
Reading the skewness number
| Skewness value | A common rule of thumb |
|---|---|
| Between −0.5 and 0.5 | Roughly symmetric |
| −1 to −0.5 or 0.5 to 1 | Moderately skewed |
| Below −1 or above 1 | Highly skewed |
These cutoffs are guidelines, not laws. With small samples, one unusual value can swing the number a lot, as our example shows.
Real-World Examples of Skewed Data
Household income (right-skewed)
Income is a textbook case. Most households earn moderate amounts, while a small number earn far more, stretching a long tail to the right. That's why the headline U.S. figure is a median. The Census Bureau reported a real median household income of $83,730 for 2024.
U.S. Census Bureau, "Income in the United States: 2024," Figure 1
Equipment failure times (right-skewed)
NIST points out that data with a hard lower limit, such as failure times in reliability studies, are typically skewed right. A part can't fail before time zero, but a few units may last much longer than the rest.
Scores on an easy quiz (left-skewed)
When a quiz is easy, most students score near the top, and a few low scores trail off to the left. The mean ends up slightly below the median.
Daily rainfall (right-skewed)
Most days bring little or no rain, while an occasional storm dumps several inches. The result is a pile of values near zero and a long right tail.
Why Skewness Matters
Skew changes which numbers you should trust.
- Averages can mislead. In right-skewed data, the mean overstates what a typical case looks like. Report the median alongside it.
- Spread needs a different measure. The standard deviation is sensitive to a long tail. The interquartile range focuses on the middle 50% and describes skewed data more fairly than the simple range.
- Some tests assume symmetry. Methods built on the normal distribution can give shaky results with strongly skewed data, especially in small samples. Analysts often transform the data (taking logs is common for incomes) or use methods that rely on medians and ranks.
- Skew can be a clue. A long tail might reveal outliers, data entry errors, or a real group that behaves differently, like a few customers who place huge orders.
Common Mistakes and Myths
| Myth | Reality |
|---|---|
| "Right-skewed means most values are on the right." | It means the long tail is on the right. Most values sit on the left. |
| "Skewed data is bad data." | Skew is a shape, not an error. Income and wait times are naturally skewed. |
| "Skewed and biased mean the same thing." | Bias is a flaw in how data was collected; skew is the shape of the data. |
| "The mean is always the best average." | For skewed data, the median usually describes a typical case better. |
| "Mean > median always proves right skew." | It's a strong hint, but small or unusual datasets can break the rule. Check a chart too. |
| "You should always remove the tail values." | Only remove values that are genuine errors. Real extremes are part of the story. |
Frequently Asked Questions
What does skewed mean in simple terms?
Skewed means lopsided. Most of the values bunch up on one side of the chart, and a few stretch out far on the other side, forming a long tail. The direction of that tail gives the skew its name: a tail on the right means right-skewed, and a tail on the left means left-skewed.
Is positive skew the same as right skew?
Yes. Positive skew and right skew describe the same shape: a long tail stretching toward higher values. Likewise, negative skew and left skew both describe a long tail toward lower values. The terms "positive" and "negative" come from the sign of the skewness number that software calculates.
Which average should I use for skewed data?
Use the median as your main "typical value," because extreme values in the tail don't drag it around. It's still useful to report the mean too, since the gap between the two tells readers how strong the skew is. Pair the median with the interquartile range to describe spread.
What does a skewness of 0 mean?
A skewness of 0 means the data is balanced around its mean, with tails of similar length on both sides. The normal distribution has a skewness of exactly 0. In real data you'll rarely see exactly zero, so values between about −0.5 and 0.5 are usually treated as roughly symmetric.
Can data be skewed and still have no outliers?
Yes. Skew describes the overall shape, while outliers are individual values that sit unusually far from the rest. A distribution can taper smoothly into a long tail with no single point that stands out as an outlier. Daily rainfall and many waiting time datasets often look like this.
How do you calculate skewness in Excel?
Type =SKEW(A1:A10) to get the sample skewness for data in cells A1 to A10. A positive result means right skew and a negative result means left skew. For the quick Pearson version, use =3*(AVERAGE(A1:A10)-MEDIAN(A1:A10))/STDEV.S(A1:A10).
Conclusion
Skewed data is data that leans. Most values gather on one side while a long tail stretches out on the other, and that tail pulls the mean along with it. You can spot skew with a histogram, by comparing the mean with the median, or by calculating a skewness number. When data is skewed, the median and interquartile range usually tell a more honest story than the mean and standard deviation.
Keep this rule in your pocket: follow the tail. Wherever the long tail points, that's the direction of the skew, and that's the direction the mean has been dragged.
Disclaimer
This article is for general educational purposes only. The book-reading data in the worked example is illustrative. For research or professional analysis, consult a qualified statistician.