

Two cities can have the same average temperature and still feel completely different. One might stay between 24 °C and 28 °C throughout the day. The other might swing from 12 °C at dawn to 40 °C by afternoon.
Quick Info
| Topic | Detail |
|---|---|
| What it is | The difference between the highest and lowest values in a data set |
| Formula | Range = Highest value − Lowest value |
| What it measures | How spread out the data is |
| Type | Measure of dispersion |
| Can it be negative? | No. The smallest possible range is 0 |
| Main weakness | One extreme value can change it significantly |
| Common uses | Temperatures, prices, exam scores, sports and quality control |
| Reading time | About 8 minutes |
The average alone cannot show that difference. The range can. It tells you how far your data stretches, from its smallest value to its largest.
In this guide, you’ll learn how to identify the highest and lowest values, calculate the range using one simple formula, and apply it to practical examples involving temperatures, prices, exam marks, and more. You’ll also discover its biggest weakness and learn which statistical measure can provide a more reliable picture when extreme values are involved.
What Is Range in Statistics?
The range is the difference between the highest and lowest values in a data set. It tells you how widely the values are spread.
Statisticians call it a measure of dispersion, or a measure of spread.
The NIST/SEMATECH e-Handbook of Statistical Methods defines the range as the largest observation minus the smallest observation. It is one of the simplest ways to describe how spread out a group of numbers is.
Highest and Lowest Values
Every range calculation starts with two numbers:
- Highest value (maximum): The largest number in the data set.
- Lowest value (minimum): The smallest number in the data set.
All the other observations fall somewhere between these two values. The range measures the distance from one extreme to the other.
For example, consider these numbers:
12, 15, 18, 20, 25
The highest value is 25, while the lowest is 12.
Range = 25 − 12 = 13
This means the data covers a spread of 13 units.
Centre vs Spread: Why Does Range Matter?
The mean, median, and mode are measures of central tendency. Each describes a different aspect of what is typical or central in a data set.
The range answers a different question: how far apart are the values?
You need both central tendency and spread to understand data properly. Consider these two classes, each with a mean score of 70.
| Class | Scores | Mean | Range |
|---|---|---|---|
| Class A | 68, 69, 70, 71, 72 | 70 | 72 − 68 = 4 |
| Class B | 40, 55, 70, 85, 100 | 70 | 100 − 40 = 60 |
Both classes have exactly the same average. However, Class A has scores close together, while Class B has much greater variation.
A teacher would approach these two classes differently. Class A shows relatively consistent performance, while Class B has a much wider gap between its highest and lowest scores.
The range reveals this difference, which the mean cannot show on its own.
If you want to understand the different ways of describing the centre of a data set, read our guides on what a mean is in statistics, finding the median, and understanding the mode.
How to Calculate the Range
The range has one of the simplest formulas in statistics:
Range = Highest value − Lowest value
Using mathematical symbols:
R = x(max) − x(min)
Here:
- R represents the range.
- x(max) represents the maximum value.
- x(min) represents the minimum value.
The rule is straightforward: find the largest number, find the smallest number, and subtract the smaller one from the larger one.
Step-by-Step Method
Follow these four steps to calculate the range correctly:
- Find the highest value. Look through the entire data set and identify its largest number.
- Find the lowest value. Identify the smallest number. Pay special attention to negative values.
- Subtract the lowest from the highest. This gives you the range.
- Include the correct units. If your measurements are in degrees Celsius, centimetres, rupees, or minutes, use the same unit in your answer.
For example, consider the numbers 8, 12, 5, 19, and 14.
- Highest value = 19
- Lowest value = 5
- Range = 19 − 5 = 14
The answer is 14.
Remember that the range cannot be negative. If every value in the data set is identical, the range is zero because there is no spread.
Practical Examples of Range
Let’s work through different situations to see how the range is calculated and used.
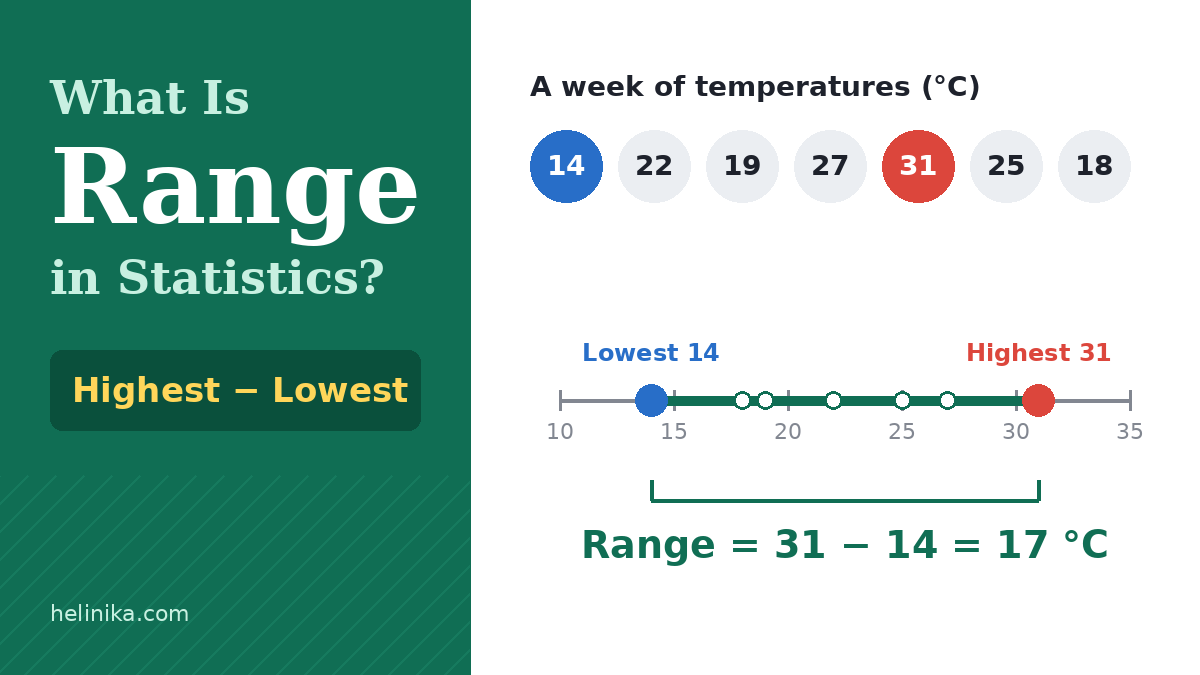
Example 1: A Week of Temperatures
Suppose the daily high temperatures in a city over seven days are:
14, 22, 19, 27, 31, 25, 18 °C
To find the range:
- Highest temperature = 31 °C
- Lowest temperature = 14 °C
- Range = 31 − 14 = 17 °C
The temperature range for the week is 17 °C.
This tells us the difference between the warmest and coolest daily high temperatures during that period.
Example 2: Working with Negative Numbers
Negative values can make range calculations slightly confusing, especially when subtraction is involved.
Consider these night-time temperatures in a mountain town:
−6, −2, 3, −9, 1, 5 °C
First, identify the extremes:
- Highest temperature = 5 °C
- Lowest temperature = −9 °C
Now subtract:
Range = 5 − (−9)
Range = 5 + 9
Range = 14 °C
Remember that subtracting a negative number is the same as adding a positive number. This is an important rule when working with temperatures below zero.
Example 3: Comparing Prices
Imagine the same smartphone is available at four different shops for these prices:
$349.99, $329.99, $359.99, and $339.99.
The calculation is:
-
Highest price = $359.99
-
Lowest price = $329.99
-
Range = $359.99 − $329.99 = $30.00
The price range is $30.00.
This difference helps shoppers understand how much prices vary between sellers. However, it does not automatically mean the cheapest seller offers the best deal. Warranty, delivery charges, and product authenticity also matter.
Example 4: When One Outlier Changes Everything
An outlier is a value that is unusually far away from the other observations.
Suppose an online store records these delivery times for seven orders:
2, 3, 3, 4, 2, 3, 21 days
One parcel was delayed because it got lost in a warehouse.
With the delayed parcel:
- Highest value = 21 days
- Lowest value = 2 days
- Range = 21 − 2 = 19 days
Without the delayed parcel:
- Highest value = 4 days
- Lowest value = 2 days
- Range = 4 − 2 = 2 days
The range increases from 2 to 19 days because of one unusually late delivery.
Six of the seven orders arrived within a two-day range. Yet one delayed parcel makes the overall spread look much larger.
This demonstrates the biggest weakness of the range: it is highly sensitive to extreme values.
Example 5: Finding the Range from a Frequency Table
Frequency tables show how often each value appears in a data set.
Consider the quiz marks of 26 students:
| Marks | Number of Students (f) |
|---|---|
| 4 | 0 |
| 5 | 3 |
| 6 | 7 |
| 7 | 9 |
| 8 | 5 |
| 9 | 2 |
| 10 | 0 |
| Total | 26 |
The table includes marks from 4 to 10, but nobody actually scored 4 or 10.
Therefore, we should only consider values with a frequency greater than zero.
- Highest score achieved = 9
- Lowest score achieved = 5
- Range = 9 − 5 = 4 marks
The range is 4 marks.
Important: Never use a value with zero frequency when finding the range from a frequency table. Only consider values that actually occur.
Example 6: Finding the Range from Grouped Data
Grouped data presents observations in intervals rather than listing every individual value.
Consider the heights of plants in a school garden:
| Height (cm) | Number of Plants (f) |
|---|---|
| 10–20 | 4 |
| 20–30 | 9 |
| 30–40 | 12 |
| 40–50 | 6 |
| 50–60 | 3 |
| Total | 34 |
Unlike an ordinary list, this table does not show the exact height of every plant.
We can estimate the range using the lowest and highest class limits:
Range = Upper limit of highest class − Lower limit of lowest class
Range = 60 − 10
Estimated range = 50 cm
Because the exact observations are not available, this is an estimate rather than the precise range of the original measurements.
Some textbooks use class boundaries instead of class limits. Follow the method specified by your teacher or examination board.
Example 7: Quality Control in a Workshop
Manufacturing businesses use measurements to check whether products are being made consistently.
Imagine a workshop producing triangular metal brackets. A batch is accepted only if the range of the measured side lengths is 0.5 cm or less.
Six brackets have these measurements:
30.2, 29.8, 30.0, 30.4, 29.9, 30.1 cm
Find the highest and lowest measurements:
- Highest = 30.4 cm
- Lowest = 29.8 cm
Range = 30.4 − 29.8
Range = 0.6 cm
The permitted range is 0.5 cm, but the calculated range is 0.6 cm.
Therefore, the batch fails the stated range requirement.
Notice that the average measurement is approximately 30.07 cm, which is close to the target of 30 cm. However, the range reveals that the measurements are not consistent enough to meet the given requirement.
This is why range can be useful in quick manufacturing checks. It is worth remembering, though, that range alone does not prove every individual product meets its required dimensions.
If you are interested in the geometry behind these products, explore our guide to triangles, their properties, types, and formulas.
Example 8: Comparing Two Batsmen’s Scores
Range is also useful in sports when comparing consistency.
Suppose two batsmen record these scores over five matches:
| Batsman | Scores | Mean | Range |
|---|---|---|---|
| A | 45, 50, 52, 48, 55 | 50 | 55 − 45 = 10 |
| B | 5, 90, 12, 110, 33 | 50 | 110 − 5 = 105 |
Both batsmen have the same mean score of 50 runs.
However, Batsman A has a range of only 10, while Batsman B has a range of 105.
This suggests that Batsman A has been more consistent across these five matches. Batsman B’s scores vary much more.
For a team captain, this information can be useful when considering a player’s consistency rather than looking at the average alone.
Range vs Mean, Median and Mode
The range is not a type of average. It measures spread, while the mean, median, and mode describe different aspects of central tendency.
Here is a quick comparison:
| Measure | What It Tells You | Type |
|---|---|---|
| Mean | The equal-share average | Central tendency |
| Median | The middle value after arranging the data | Central tendency |
| Mode | The most frequently occurring value | Central tendency |
| Range | The difference between the highest and lowest values | Dispersion |
Each measure has a different purpose.
For example, an average exam score of 70 tells a teacher about the overall performance of a class. Adding a range of 4 shows that the highest and lowest scores are relatively close together.
Together, these measures provide more information than the average alone.
Advantages and Limitations of the Range
The range is popular because it is easy to calculate. However, it also has limitations that are important to understand.
Advantages
- Easy to calculate: You only need the highest and lowest values.
- Simple to understand: Even beginners can interpret the result.
- Uses familiar units: The answer stays in the same units as the original measurements.
- Useful for quick comparisons: It helps compare variation between small data sets.
- Helpful in quality control: Businesses can use it to check the spread of measurements.
Limitations
- Uses only two values: It ignores all the observations between the extremes.
- Sensitive to outliers: One unusually high or low value can change the result significantly.
- Does not show the distribution: It cannot tell you whether most values are close together or spread throughout the interval.
- Can increase with sample size: As more observations are collected, the range can stay the same or increase when a new extreme value appears.
- Does not describe the centre: It cannot tell you what a typical observation looks like.
The NIST handbook’s explanation of measures of scale also highlights that the range only considers the two extreme observations. It does not describe how the remaining values are distributed.
The Interquartile Range: A More Reliable Alternative When Outliers Matter
When extreme values make the range misleading, statisticians often use another measure called the interquartile range (IQR).
Instead of measuring the distance between the smallest and largest values, the IQR measures the spread of the middle 50% of a sorted data set.
Its formula is:
IQR = Q3 − Q1
Where:
- Q1 (first quartile): The lower quartile, representing the 25th percentile.
- Q3 (third quartile): The upper quartile, representing the 75th percentile.
The interquartile range is less sensitive to extreme values because it focuses on the central half of the observations rather than the two extremes.
For example, consider these delivery times:
2, 3, 3, 4, 2, 3, 21 days
The range is 19 days because of the unusually late delivery.
However, the IQR focuses on the middle portion of the data and provides a better picture of how most deliveries are grouped.
This makes it especially useful when working with data that contains outliers or has a strongly uneven distribution.
Common Mistakes to Avoid When Calculating Range
Students often make small mistakes when calculating the range. Here are some common ones to watch out for:
- Subtracting in the wrong order: Always subtract the lowest value from the highest value.
- Using the first and last numbers of an unsorted list: They may not be the actual maximum and minimum.
- Ignoring negative signs: Remember that 5 − (−9) equals 14, not −4.
- Including zero-frequency values: In frequency tables, only count values that actually occur.
- Giving two values instead of one: Saying “from 14 to 31” describes the interval, not the range. The range is 17.
- Forgetting units: A range of 17 is incomplete when the measurements are in degrees Celsius. Write 17 °C instead.
Checking these details can help prevent simple calculation errors.
Where You’ll See the Range in Real Life
Range is not just a classroom concept. It is useful in several everyday situations.
- Weather: Comparing the highest and lowest temperatures over a day, week, or season.
- Shopping: Checking how much prices vary between different sellers.
- Education: Measuring the gap between the highest and lowest exam scores in a class.
- Sports: Comparing a player’s best and worst performances.
- Manufacturing: Checking whether products are being produced with consistent measurements.
- Finance: Examining the difference between the highest and lowest prices of a share during a particular period.
In each situation, the range gives a quick indication of how widely the values vary.
Frequently Asked Questions
What is range in statistics in simple words?
Range is the difference between the largest and smallest numbers in a data set. It tells you how far apart the extreme values are.
What is the formula for range?
The formula is:
Range = Highest value − Lowest value
Find the largest and smallest values, then subtract the smaller one from the larger one.
Can the range be negative?
No. The range cannot be negative because the highest value is always greater than or equal to the lowest value.
The smallest possible range is zero, which occurs when every value in the data set is identical.
Can the range be a decimal?
Yes. If the original measurements contain decimals, the range can also be a decimal.
For example, if the highest measurement is 30.4 cm and the lowest is 29.8 cm, the range is 0.6 cm.
Is the range affected by outliers?
Yes. The range is highly sensitive to outliers because it depends entirely on the highest and lowest values.
One unusually large or small observation can significantly increase the result.
What is the difference between range and interquartile range?
The range measures the difference between the highest and lowest values in a data set.
The interquartile range measures the spread of the middle 50% of the observations. It is generally less affected by extreme values.
What happens when all values in a data set are the same?
The range becomes zero because the highest and lowest values are identical.
For example:
8, 8, 8, 8, 8
Range = 8 − 8 = 0
This means there is no variation in the data.
Does the range use every value in a data set?
No. The range only uses the highest and lowest values. It ignores all the other observations when calculating the result.
Conclusion
The range is one of the quickest ways to understand how spread out a data set is. Find the highest value, identify the lowest value, and subtract. That single calculation tells you how far apart the extremes are.
It is useful for comparing exam scores, temperatures, prices, sports performances, and manufacturing measurements. However, the range cannot describe the full distribution of data because it depends on only two observations.
Remember its biggest weakness: an extreme value can change the result significantly. When outliers are present, consider using the interquartile range as well.
Understanding both measures will help you make better sense of statistical data and choose the right tool for different situations.
References
- NIST/SEMATECH e-Handbook of Statistical Methods – Measures of Scale
- Australian Bureau of Statistics – Statistical Language: Range
Disclaimer
This article is for general educational purposes only. All examples, prices, scores, and measurements are simplified, illustrative data used to explain statistical concepts. Methods for calculating range from grouped data can differ between textbooks and examination boards, so always follow your teacher’s or syllabus guidelines. For research or professional data analysis, consult a qualified statistician.