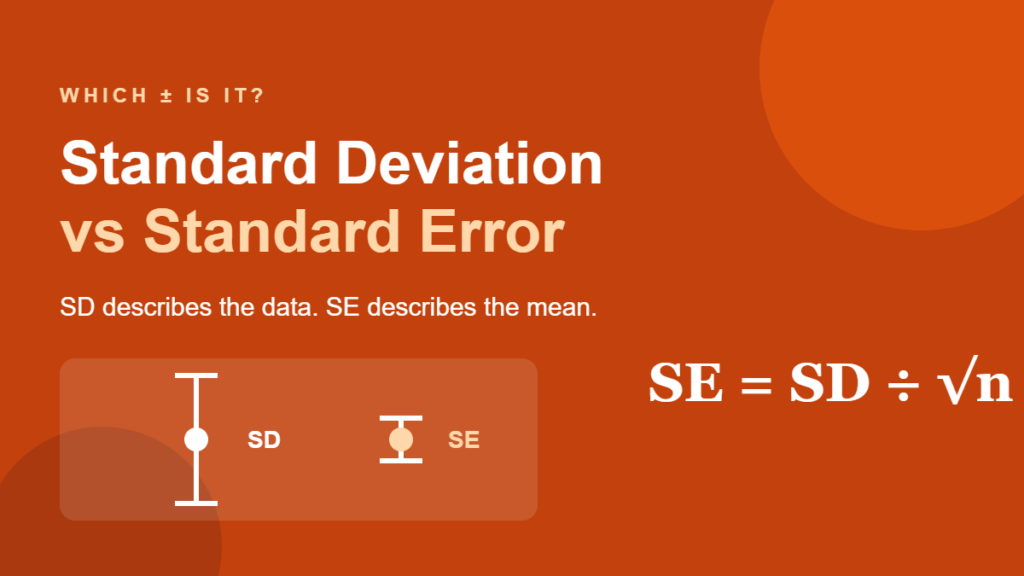
Two tutoring programs post their results side by side. Program A’s students gained an average of 8 points with “± 5.0.” Program B’s gained 11 points with “± 1.1.” At a glance, B looks far more consistent. It isn’t. The two numbers after the ± sign are different measures, and that mix-up is the whole story of standard deviation vs standard error.
The standard deviation tells you how much individual students differ from each other. The standard error tells you how sure you can be about the group’s average. Both use the same data, both sit after a ± sign, and they answer completely different questions.
This guide skips the textbook recap and focuses on the practical side: how to tell which one you’re looking at, which one to report, and why the same results can look convincing or unconvincing depending on which error bar a chart uses.
Quick Info
| Topic | Detail |
|---|---|
| Short answer | SD describes the data; SE describes the precision of the mean |
| Link between them | SE = SD ÷ √n |
| Effect of a bigger sample | SD stays about the same; SE gets smaller |
| Report SD when | Describing a group, a table of results, or how values vary |
| Report SE (or a 95% CI) when | Showing how precise an estimate is or comparing averages |
| Common mistake | Writing “mean ± SE” to make data look tidier |
| Reading time | About 10 minutes |
Standard Deviation vs Standard Error in One Sentence
Standard deviation measures how spread out individual values are; standard error measures how much the sample mean would bounce around if you repeated the study.
If you need a refresher on either one, start with our guides to standard deviation and standard error. Here, we’ll put them head to head.
The classroom analogy
Picture a class of 25 students. Their test score gains range widely: some improved by 1 point, others by 15. The standard deviation captures that range of individual results.
Now imagine 100 different classes of 25, each taught the same way. Their class averages would be much closer together than the individual students, because highs and lows cancel out inside each class. The standard error captures that tighter spread of averages.
Side-by-side comparison
| Feature | Standard deviation (SD) | Standard error (SE or SEM) |
|---|---|---|
| Describes | Individual values | The sample mean (an estimate) |
| Answers | “How different are the people?” | “How precise is the average?” |
| Formula | s = √[Σ(x − x̄)² ÷ (n − 1)] | SE = s ÷ √n |
| Units | Same as the data | Same as the data |
| Bigger sample | Settles near the true spread | Keeps shrinking |
| Always smaller? | No | Never larger than SD |
| Used for | Describing data, z-scores, normal ranges | Confidence intervals, hypothesis tests |
How They’re Connected
The standard error isn’t a separate measurement. You get it by taking the standard deviation and dividing by the square root of the sample size:
SE = SD ÷ √n
- SD is the sample standard deviation.
- n is the number of values in the sample.
- √n is its square root.
Why dividing by √n isn’t “double counting”
A fair question pops up often: the standard deviation already divides by n − 1 inside its formula, so why divide again? The two divisions do different jobs.
The division inside the SD averages the squared distances, so the SD describes a typical individual. It doesn’t shrink as you add people, because more people don’t make individuals less different.
The extra division by √n reflects what happens when you average n values. Random highs and lows partly cancel, so an average is steadier than any one value. The more values you average, the steadier it gets. If the square root part is new to you, our comparison of variance and standard deviation explains why spread measures behave this way.
Worked Example: Two Tutoring Programs
Let’s use one dataset and calculate both numbers, so you can see exactly where they come from. The figures are illustrative.
| Program | Students (n) | Mean gain | SD |
|---|---|---|---|
| A | 25 | 8.0 points | 5.0 points |
| B | 25 | 11.0 points | 5.5 points |
Step 1: Read the standard deviations
Program A’s SD is 5.0 and Program B’s is 5.5. Individual students in both programs vary a lot, and by about the same amount. In Program A, many students gained somewhere between about 3 and 13 points (the mean plus or minus one SD).
Step 2: Take the square root of n
√25 = 5
Step 3: Calculate each standard error
Program A: SE = 5.0 ÷ 5 = 1.0 point
Program B: SE = 5.5 ÷ 5 = 1.1 points
Step 4: Turn the SE into a 95% confidence interval
For a sample of 25, the multiplier from the t-distribution is about 2.064.
Program A: 8.0 ± 2.064 × 1.0 = 5.94 to 10.06
Program B: 11.0 ± 2.064 × 1.1 = 8.73 to 13.27
Step 5: Spot the mix-up from the introduction
Remember “Program A: 8 ± 5.0” and “Program B: 11 ± 1.1”? Program A reported its SD. Program B reported its SE. Program B wasn’t more consistent at all. Its students varied slightly more than Program A’s. The smaller number came from a different formula, not from better teaching.
Same Data, Three Different Error Bars
Charts make this confusion even easier to miss. A bar or dot with a line above and below it could show the SD, the SE or a 95% confidence interval. Here’s what each would look like for our two programs:
| Error bar type | Program A range | Program B range | Do they overlap? |
|---|---|---|---|
| ±1 SD | 3.0 to 13.0 | 5.5 to 16.5 | Heavily |
| ±1 SE | 7.0 to 9.0 | 9.9 to 12.1 | No |
| 95% CI | 5.94 to 10.06 | 8.73 to 13.27 | Slightly |
Same students, same scores, three very different pictures. The SD bars suggest the programs are nearly identical. The SE bars suggest a clear winner. Neither impression is quite right on its own.
What the test actually says
A two-sample t-test on these numbers gives a p-value of about 0.049, right on the conventional 0.05 line. So there’s modest evidence that Program B helps more, not the slam dunk the SE bars imply, and not the “no difference” the SD bars imply.
Notice something else: the 95% confidence intervals overlap, yet p is just under 0.05. Overlapping confidence intervals don’t automatically mean “no significant difference,” and non-overlapping SE bars don’t automatically mean “significant.” To compare two groups properly, run the test (our P-Value Calculator can help) instead of eyeballing bars.
Try it: switch the error bars and the sample size
Choose an error bar type, then change the number of students per program. The means and SDs stay fixed. Watch how the SD bars barely move while the SE and confidence interval bars shrink as the sample grows.
Means (8.0 and 11.0) and SDs (5.0 and 5.5) stay fixed. Only the type of bar and the sample size change. Illustrative data.
What changes as the sample grows
| Students per program | SE (A) | SE (B) | p-value for the difference |
|---|---|---|---|
| 10 | 1.58 | 1.74 | 0.22 |
| 25 | 1.00 | 1.10 | 0.049 |
| 50 | 0.71 | 0.78 | 0.005 |
| 100 | 0.50 | 0.55 | 0.0001 |
The gap between the programs (3 points) and the spread among students (about 5 points) never changed. Only our certainty about the averages did. That’s the standard error at work.
Which One Should You Report?
Here’s a decision guide you can use for school projects, lab reports or workplace dashboards.
| Your goal | Report | Example wording |
|---|---|---|
| Describe the people or items in your study | Mean and SD | “Gains averaged 8.0 points (SD 5.0).” |
| Show a typical range for individuals | SD | “Most students gained 3 to 13 points.” |
| Show how precise an average is | 95% CI (or SE) | “Mean gain 8.0 (95% CI 5.9 to 10.1).” |
| Compare two averages | CI of the difference and a p-value | “B beat A by 3.0 points, p = 0.049.” |
| Data is skewed or has outliers | Median and IQR | “Median gain 7 (IQR 4 to 11).” |
Several statistics guides recommend a confidence interval over a bare SE. In a 2020 editorial for the Indian Journal of Psychological Medicine, Chittaranjan Andrade argues that the mean should always come with the SD when describing a sample, and that a 95% confidence interval is more useful to readers than the SEM.
For data with a long tail or extreme values, neither SD nor SE tells the full story. The median and interquartile range usually describe skewed data better.
How Often Does the Mix-Up Happen?
More often than you’d think, even in medical research. A 2018 statistics note in the Medical Journal of Australia summarized two journal reviews. One found that 23% of articles in four anesthesia journals (198 of 860) used the SEM inappropriately to describe data. Another found that 52% of articles in three cardiovascular journals (228 of 441) stated in their methods that they used the SEM to describe data.
The same article warns that using the SEM in place of the SD to describe how individuals vary can be grossly misleading. Its example compares an SEM of 0.37 mmHg with an SD of 8.4 mmHg for the same blood pressure data.
Quick Checks for Readers
Next time you see a ± sign or an error bar, run through these three questions:
- Is it labeled? If a table or chart doesn’t say SD, SE or CI, treat the result with caution.
- Does the bar shrink with sample size? Compare studies of different sizes. SE and CI bars should be much narrower in larger studies; SD bars shouldn’t.
- Does the spread make sense for individuals? If “± 1.1” is supposed to describe test score gains for real students, ask yourself whether almost every student really gained between 10 and 12 points. If that sounds too tidy, it’s probably an SE.
These checks build on core ideas from inferential statistics, where every estimate from a sample comes with some uncertainty.
Common Mistakes and Myths
| Myth | Reality |
|---|---|
| “A smaller ± number means less variable data.” | Only if both numbers are SDs. An SE is always smaller by design. |
| “SE is a more advanced, better version of SD.” | They answer different questions. Neither replaces the other. |
| “SD should shrink if I collect more data.” | It settles near the true spread. Only the SE keeps shrinking. |
| “Non-overlapping SE bars prove a real difference.” | Run a test. Visual rules for SE bars are rough at best. |
| “Overlapping 95% CIs prove there’s no difference.” | Our example overlaps and still has p ≈ 0.049. |
| “Reporting SE makes my results more scientific.” | It can make data look more precise than it is. Describe with SD. |
Frequently Asked Questions
Is standard error the same as standard deviation?
No. Standard deviation describes how much individual values vary around their mean. Standard error describes how much the sample mean itself would vary from one sample to the next. They’re linked by SE = SD ÷ √n, so the standard error is always smaller than or equal to the standard deviation, but they answer different questions.
Why is the standard error smaller than the standard deviation?
Because averaging cancels out some of the randomness. One student might gain 15 points and another 1, but the average of 25 students will land much closer to the true average than most individuals do. Dividing the SD by √n captures how much steadier an average is than a single value.
When should I use standard deviation instead of standard error?
Use standard deviation whenever you’re describing the people, objects or measurements in your data: in a summary table, a methods section, or a statement about a typical range. Switch to the standard error, or better a 95% confidence interval, when you want to show how precise an estimated average is or compare averages between groups.
Should error bars show SD or SE?
It depends on the message. Use SD bars to show how much individuals vary. Use SE or 95% confidence interval bars to show how precisely each mean is estimated. Whichever you choose, say so in the caption, along with the sample size, because readers can’t tell the difference from the bars alone.
How do I convert standard error back to standard deviation?
Multiply the standard error by the square root of the sample size: SD = SE × √n. If a study reports a standard error of 1.1 from 25 people, the standard deviation is 1.1 × 5 = 5.5. This trick helps when you want to compare a study that reported SE with one that reported SD.
Can I compare an SD from one study with an SE from another?
Not directly. Convert them to the same measure first using the sample sizes. Comparing an SD with an SE is like comparing a person’s height with the height of a class average’s wobble: the numbers live on different scales, so the smaller one isn’t automatically better.
Conclusion
Standard deviation and standard error come from the same data, but they describe different things. The SD tells you how much individuals differ, and it stays roughly the same as your sample grows. The SE tells you how precisely you’ve pinned down the average, and it shrinks as you collect more data. Mixing them up can make a result look more consistent, or more convincing, than it really is.
A rule to remember: describe with SD, estimate with SE, and always label your ±. When in doubt, report the mean with its SD and a 95% confidence interval, and let readers see both stories.
Disclaimer
This article is for general educational purposes only. The tutoring program figures in the worked example are illustrative. For study design or published research, consult a qualified statistician.