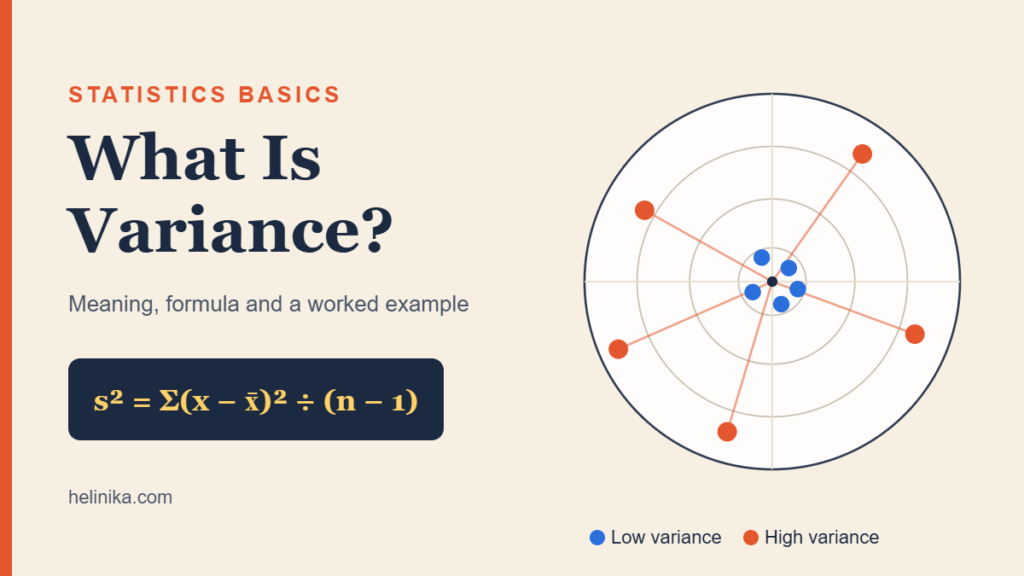
Two pizza drivers both average 30 minutes per delivery. One shows up between 28 and 32 minutes every time. The other might arrive in 22 minutes tonight and 38 minutes tomorrow. Same average, very different experience for a hungry customer.
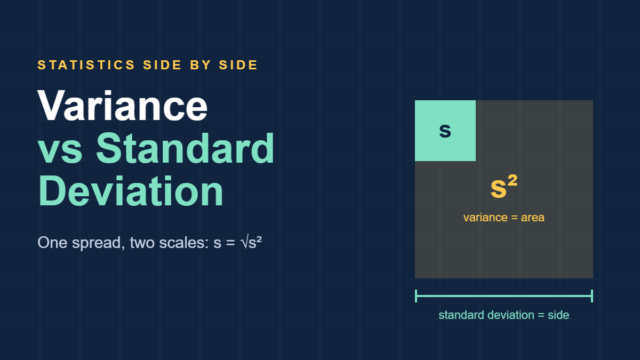
That difference has a name. The variance meaning in statistics is simple: variance measures how far the values in a data set spread out from their mean, by averaging the squared distance of each value from that mean. A small variance says the data stays close to the average. A large variance says the data is scattered.
Averages hide this. Variance exposes it, which is why it sits underneath standard deviation, quality control, investment risk and many of the statistical tests you’ll meet later.
This guide covers what variance means, the two formulas, a full worked example, an interactive chart you can play with, and the mistakes students make most often.
Quick Info
| Topic | Detail |
|---|---|
| Short definition | The average squared distance of each value from the mean |
| Sample formula | s² = Σ(x − x̄)² ÷ (n − 1) |
| Population formula | σ² = Σ(x − μ)² ÷ N |
| Units | Squared units of the original data (minutes², dollars²) |
| Smallest possible value | 0, when every value is identical |
| Common mistake | Dividing by n instead of n − 1 for a sample |
| Reading time | About 10 minutes |
What Is Variance in Statistics?
Variance is a single number that tells you how spread out a data set is, found by squaring each value’s distance from the mean and averaging those squares.
Think of the mean as a target. Every data point lands somewhere around it. Variance asks one question: on average, how badly do the points miss the target? The catch is that each miss gets squared before it is averaged, so big misses count much more than small ones.
The NIST/SEMATECH e-Handbook of Statistical Methods describes the sample variance as roughly the arithmetic average of the squared distance from the mean, and groups it with the range and standard deviation as a measure of scale.
NIST/SEMATECH e-Handbook, “Measures of Scale”
Variance meaning in plain words
If you want a one-line version to remember, use this: variance is the average squared miss from the mean.
- Low variance: values huddle around the mean. Results are consistent and predictable.
- High variance: values sprawl far from the mean. Results are inconsistent and harder to predict.
- Zero variance: every value is exactly the same. There is no spread at all.
Where variance sits among measures of spread
Variance is one of several ways to describe spread. Each answers a slightly different question.
| Measure | What it uses | Units | Best for |
|---|---|---|---|
| Range | Only the highest and lowest values | Original | A quick, rough check |
| Interquartile range | The middle 50% of the data | Original | Skewed data or data with outliers |
| Variance | Every value, squared distance from the mean | Squared | Math, modeling and statistical tests |
| Standard deviation | Square root of the variance | Original | Describing spread to people |
Why Does Variance Square the Distances?
This is the question most students ask first, and it has three good answers.
1. Plus and minus would cancel out
If you simply add up the distances from the mean, the positives and negatives always cancel to exactly zero. That’s a property of the mean itself. Squaring turns every distance into a positive number, so nothing cancels.
2. Big misses deserve extra weight
A value 2 units from the mean contributes 4 to the total. A value 8 units away contributes 64, sixteen times as much, even though it is only four times as far. Variance is deliberately sensitive to values that sit far from the center.
3. Squares behave well in math
Squared distances are easy to work with in algebra and calculus. That’s why variance, not some other spread measure, shows up inside regression, analysis of variance (ANOVA) and many probability formulas.
The Variance Formulas: Sample vs Population
There are two versions of the formula. Which one you use depends on whether your data covers everyone you care about or only a slice of them.
Population variance
Use this when you have data for the entire group, the full population.
σ² = Σ(x − μ)² ÷ N
- σ² (sigma squared) is the population variance.
- x is each individual value.
- μ (mu) is the population mean.
- Σ means “add up all of these.”
- N is the number of values in the population.
Sample variance
Use this when your data is a sample taken from a bigger group, which is the usual situation in real research.
s² = Σ(x − x̄)² ÷ (n − 1)
- s² is the sample variance.
- x̄ (x-bar) is the sample mean.
- n is the number of values in the sample.
- n − 1 is the divisor, one less than the sample size.
Why divide by n − 1?
A sample’s own mean always sits right in the middle of that sample, so distances measured from it come out a little too small compared with distances from the true population mean. Dividing by n − 1 instead of n nudges the result up to correct for this. The fix is called Bessel’s correction.
Penn State’s online statistics notes state that the sample variance computed this way is unbiased for the population variance, which means that on average it hits the true value.
Penn State STAT 505, “Measures of Dispersion”
| Question | Population variance | Sample variance |
|---|---|---|
| Symbol | σ² | s² |
| Mean used | μ (population mean) | x̄ (sample mean) |
| Divide by | N | n − 1 |
| When to use | You measured every member | You measured some members and want to estimate the whole |
Worked Example: Two Delivery Drivers
Let’s go back to the two pizza drivers from the opening. Below are six delivery times for each, in minutes. These numbers are illustrative, made up for teaching.
- Driver A: 28, 31, 29, 32, 30, 30
- Driver B: 22, 38, 25, 36, 27, 32
We’ll treat each list as a sample of that driver’s deliveries, so we’ll use n − 1.
Step 1: Find the mean
Driver A: (28 + 31 + 29 + 32 + 30 + 30) ÷ 6 = 180 ÷ 6 = 30 minutes
Driver B: (22 + 38 + 25 + 36 + 27 + 32) ÷ 6 = 180 ÷ 6 = 30 minutes
Both drivers have exactly the same average.
Step 2: Subtract the mean from each value
Each result is a deviation: how far that delivery landed from 30.
Step 3: Square each deviation
| Delivery | A time | A deviation | A squared | B time | B deviation | B squared |
|---|---|---|---|---|---|---|
| 1 | 28 | −2 | 4 | 22 | −8 | 64 |
| 2 | 31 | 1 | 1 | 38 | 8 | 64 |
| 3 | 29 | −1 | 1 | 25 | −5 | 25 |
| 4 | 32 | 2 | 4 | 36 | 6 | 36 |
| 5 | 30 | 0 | 0 | 27 | −3 | 9 |
| 6 | 30 | 0 | 0 | 32 | 2 | 4 |
| Total | 0 | 10 | 0 | 202 |
Notice the deviation columns both add to 0. That’s the canceling problem from earlier, shown with real arithmetic.
Step 4: Divide by n − 1
Driver A: 10 ÷ 5 = 2 minutes²
Driver B: 202 ÷ 5 = 40.4 minutes²
Step 5: Read the result
Driver B’s variance is about 20 times larger than Driver A’s. The averages are identical, but Driver B is far less predictable. If you needed a pizza to arrive before a game started, you’d want Driver A.
Taking the square root brings the numbers back to minutes: Driver A’s standard deviation is about 1.4 minutes and Driver B’s is about 6.4 minutes.
Try it: interactive variance chart
Switch between the two drivers below. The top panel shows each delivery’s distance from the mean. The bottom panel shows the squared deviations that variance adds up. Watch how the two far-off deliveries for Driver B dominate the total.
Illustrative data: six deliveries per driver. Variance = sum of squares ÷ (n − 1).
How to Calculate Variance: Quick Checklist
| Step | What you do | Watch out for |
|---|---|---|
| 1 | Find the mean | Double-check the count of values |
| 2 | Subtract the mean from every value | Keep the minus signs for now |
| 3 | Square each result | Squares are never negative |
| 4 | Add the squares | This total is the "sum of squares" |
| 5 | Divide by N (population) or n − 1 (sample) | Pick the divisor before you start |
A quick sanity check: your deviations from Step 2 should add to 0 (or very close, if you rounded the mean). If they don't, the mean is wrong.
How to Interpret Variance
A variance number on its own can feel abstract, so here are practical ways to read it.
Compare it, don't judge it alone
A variance of 40 is neither good nor bad by itself. It only means something when you compare it with another group measured in the same units, the way we compared the two drivers.
Remember the squared units
Driver B's variance is 40.4 minutes squared, which isn't a unit anyone thinks in. That's why people usually report the standard deviation to a general audience and keep variance for calculations.
Watch for outliers
Because distances get squared, one extreme value can inflate variance a lot. If your histogram shows a single point far from the rest, check whether it's a real value or a typing error before trusting the variance.
Where You'll See Variance in Real Life
- Manufacturing: A factory filling 16-ounce bottles wants a low variance in fill amounts. A high variance means some customers get short-changed and others get overflow.
- Investing: Analysts use variance of returns as one way to describe risk. Two funds can have similar average returns while one swings far more from year to year.
- Sports: A basketball player who scores 18 points every night and one who swings between 5 and 31 can have the same average, but coaches plan around them very differently.
- Education: Two classes can share an average test score while one has students bunched together and the other has a wide gap between top and bottom.
- Research: Tests such as ANOVA compare variances between and within groups to judge whether group differences are real or just noise, a core idea in inferential statistics.
A Useful Property: Variances Add
Here's something standard deviation can't do as neatly. When two quantities vary independently, their variances add together.
Suppose prep time at a pizza shop has a variance of 9 minutes² and driving time has a variance of 16 minutes², and the two don't affect each other. The total time from order to door has a variance of 9 + 16 = 25 minutes², so its standard deviation is 5 minutes.
Notice that you can't just add the standard deviations (3 + 4 = 7). You add the variances, then take the square root. This rule is a big reason statisticians prefer to work with variance behind the scenes.
Common Mistakes and Myths
| Myth | Reality |
|---|---|
| "Variance and standard deviation are the same thing." | Standard deviation is the square root of variance. They describe the same spread on different scales. |
| "Always divide by n." | Divide by n only for a full population. For a sample, use n − 1. |
| "A negative variance means the data is below average." | Variance can never be negative. The smallest possible value is 0. |
| "Variance is in the same units as the data." | Variance is in squared units. Only the standard deviation returns to the original units. |
| "A higher variance means a higher average." | Variance says nothing about where the center is. Our two drivers had the same mean and very different variances. |
Frequently Asked Questions
What is variance in simple words?
Variance is a measure of how spread out numbers are. You find how far each number is from the average, square those distances, and average the squares. A small result means the numbers stay close together, while a large result means they're scattered widely. If every number is the same, the variance is zero.
Can variance be negative?
No. Every deviation gets squared before it's averaged, and a squared number is never negative. The lowest possible variance is 0, which happens only when every value in the data set is identical. If you ever calculate a negative variance, there's an arithmetic error somewhere, often a missed square or a subtraction slip.
What does a high variance tell you?
A high variance tells you the values sit far from the mean and from one another. In practice, that means results are less consistent and harder to predict. Whether that's a problem depends on context. High variance in delivery times frustrates customers, while high variance in plant heights in an experiment might be exactly what a researcher is studying.
How is variance related to standard deviation?
Standard deviation is the square root of variance. If the variance is 25, the standard deviation is 5. Both measure the same spread, but standard deviation uses the data's original units, so it's easier to explain. Variance stays in squared units, which makes it more convenient inside formulas and statistical tests.
Why do we use n − 1 for sample variance?
Distances measured from a sample's own mean run slightly smaller than distances from the true population mean. Dividing by n − 1 instead of n corrects that underestimate. The adjustment is called Bessel's correction, and it makes the sample variance an unbiased estimate of the population variance. With large samples, the difference becomes tiny.
Is a variance of 0 possible in real data?
Yes, but it's rare. A variance of 0 means every observation is exactly equal, such as a machine that fills every bottle with precisely the same amount. In most real measurements, small differences always creep in, so you'll almost always see a variance above zero.
Conclusion
Variance turns "how spread out is this data?" into a single number. You find each value's distance from the mean, square it, and average the squares, dividing by N for a whole population or n − 1 for a sample. The two drivers showed why it matters: identical averages can hide very different levels of consistency.
Next time someone quotes you an average, ask the follow-up question variance was built to answer: how far do the individual values stray from it?
Disclaimer
This article is for general educational purposes only. The delivery times, factory and pizza shop figures used in the examples are illustrative, not real data. For research design or data analysis decisions, consult a qualified statistician.