

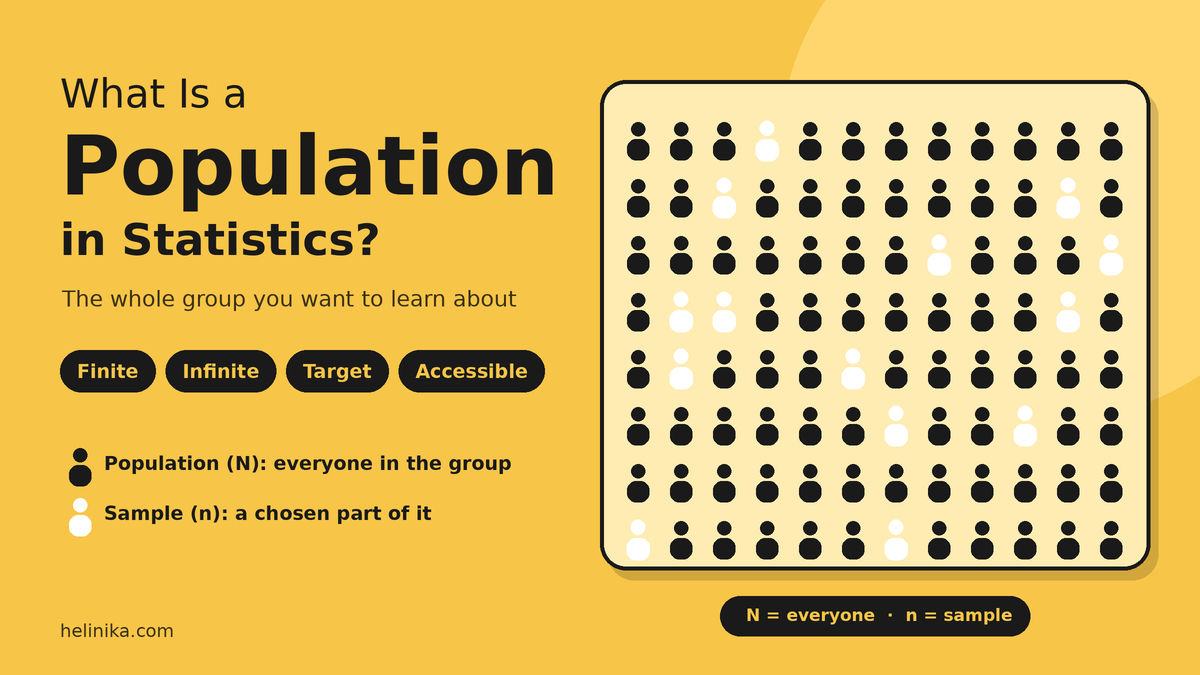
In everyday language, “population” usually means the number of people living in a place. In statistics, the term is much broader. A population can include every student in a school, every light bulb produced by a factory, every customer who bought from a business during a year, or every rainfall measurement recorded in a region.
Before collecting data, a researcher must decide exactly which people, objects, events, or measurements the study is about. That complete group is called the population. It is a fundamental idea in statistics, especially when researchers use a sample to draw conclusions about a larger group.
This guide explains the meaning of a statistical population, its key characteristics and common types, and how it differs from a sample. It also includes practical examples and a checklist for defining a population clearly.
What Is a Population in Statistics?
A population is the complete group of individuals, objects, events, or measurements that a study aims to describe or draw conclusions about. Every member belongs because it meets the criteria set by the research question.
The Australian Bureau of Statistics (ABS) explains statistical concepts using clearly defined groups and data units. A data unit is one member of the population about which information is collected—for example, one student, one business, or one manufactured item.
Three points make the definition easier to understand:
- A population does not have to consist of people. It may include cars, hospitals, trees, exam papers, products, or weather observations.
- The researcher defines the population. The boundaries depend on who or what is included, the location, and the time period.
- The population is the group the researcher wants to understand, even when measuring every member is not practical.
A Quick Example
Suppose a researcher wants to estimate the average daily screen time of teenagers living in Karachi.
| Element | Definition |
| Population | All teenagers aged 13–19 who live in Karachi. |
| Data unit | One teenager. |
| Characteristic measured | Daily screen time, measured in hours. |
| Possible sample | A group of teenagers selected from the defined population. |
A 25-year-old living in Karachi is outside this population because the age requirement is 13–19. A 15-year-old living in Lahore is also outside it because the location requirement is Karachi. Clear criteria determine who belongs.
Characteristics of a Statistical Population
1. A Shared, Clearly Defined Criterion
Every member must meet the study’s inclusion criteria. “Students” is too broad for many studies. “Students enrolled in Class 10 at government schools in Punjab during the 2026 academic year” is much more precise.
2. Clear Boundaries of Place and Time
A useful definition states where and when the population exists. Customers who visited a store in December may behave differently from customers who visited in June. The time period therefore matters.
3. A Size, Known or Unknown
The population size is commonly represented by the capital letter N. It may be known, estimated, or theoretically unlimited. A company may know that it has 42 employees, while the number of all future customers of an online shop is not fixed.
4. Variation Among Members
Members share the characteristic that places them in the population, but they may differ in the variable being studied. Teenagers in Karachi all meet the population definition, yet their daily screen time will not necessarily be the same.
5. Population Parameters
A parameter is a numerical value that describes an entire population. Parameters are often fixed for the population being studied, but researchers may not know their exact values because they have not measured every member.
| Parameter | Symbol | What it describes |
| Population size | N | Number of members in the population. |
| Population mean | μ (mu) | Average value across all population members. |
| Population standard deviation | σ (sigma) | How widely values vary across the population. |
| Population proportion | P | Share of the population with a specified characteristic. |
The population mean is calculated using the same basic idea as an ordinary mean or average: add all relevant values and divide by the number of members. The difference is that a population mean uses every member of the defined population.
Types of Population in Statistics
Populations can be classified in different ways. These categories are not all mutually exclusive: the same population may be finite, existent, and a target population at the same time.
1. Finite Population
A finite population has a fixed, countable number of members. In principle, each member can be listed.
- The 1,200 students enrolled at a particular school.
- All registered cars in Islamabad on a specified date.
- The 50 states of the United States.
2. Infinite Population
An infinite population has no fixed final number of possible members, or is treated as unlimited for the statistical model.
- All possible outcomes of repeatedly tossing a coin.
- An unlimited sequence of possible measurements from a theoretical process.
- All possible future customer transactions in a continuing business.
3. Existent (Real) Population
An existent population consists of real members that can be observed or identified at the time of the study.
- Trees in a particular park.
- Books held by a named library on a specified date.
- Patients admitted to a hospital during a defined week.
4. Hypothetical Population
A hypothetical population is a theoretical set of possible outcomes or observations. Researchers use it to reason about processes that could produce many possible results.
- All possible outcomes of rolling two dice.
- All possible future batches a factory could produce under a process.
- Possible patient outcomes under a treatment model.
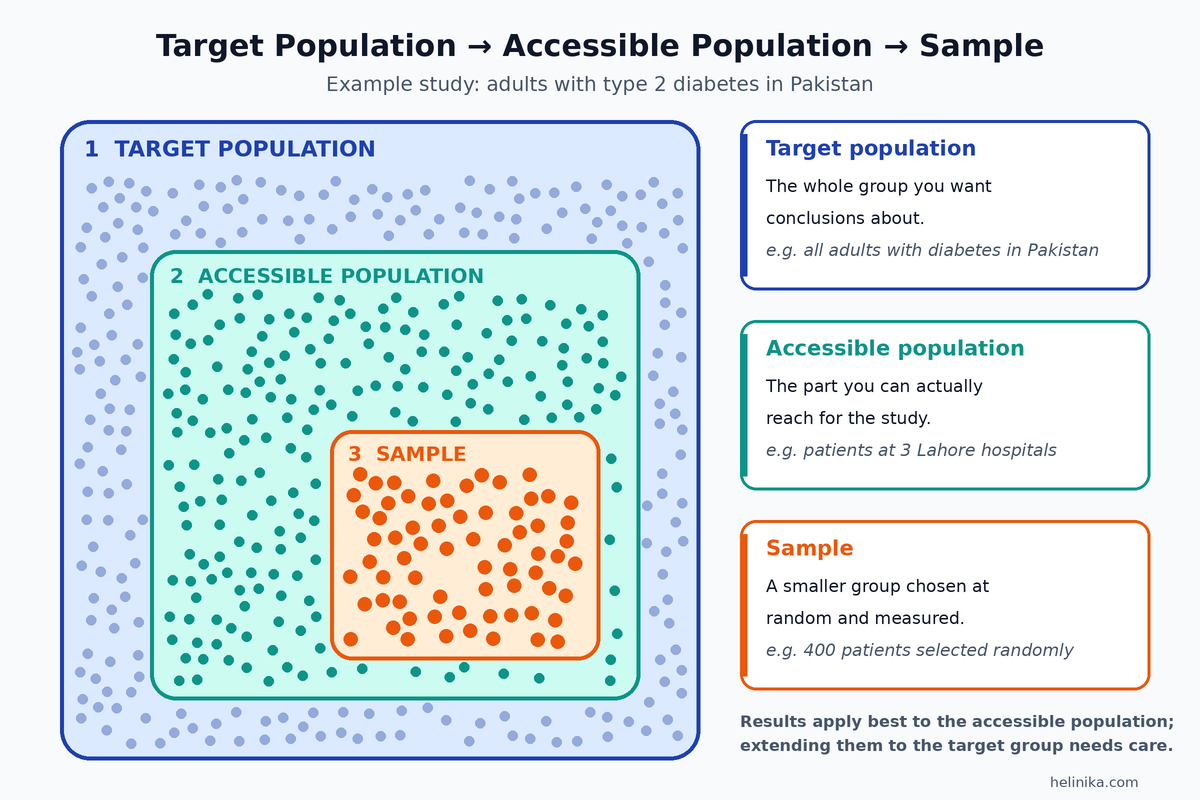
5. Target Population
The target population is the full group the researcher ultimately wants the findings to apply to. It is sometimes called the population of interest.
- All adults living in Pakistan who meet a defined set of eligibility criteria for a particular study.
6. Accessible (Study) Population
The accessible population is the part of the target population that the researcher can realistically reach for data collection.
- Eligible adults who attend three selected hospitals in Lahore during the study period.
The accessible population may differ from the target population. If hospital visitors have different characteristics from people who do not visit those hospitals, findings may not represent all eligible adults in Pakistan. Researchers should explain this limitation.
| Type | Key idea | Example |
| Finite | Fixed, countable size | Students enrolled at one school. |
| Infinite | Unlimited theoretical set or process | All possible outcomes in an unlimited sequence of coin tosses. |
| Existent | Real and observable | Books in a library on a given date. |
| Hypothetical | Theoretical or possible outcomes | All possible outcomes of rolling two dice. |
| Target | Group the researcher wants to understand | All eligible adults in a defined national study. |
| Accessible | Group the researcher can actually reach | Eligible patients at selected hospitals. |
Examples of Populations in Different Fields
| Field | Research question | Population | Data unit |
| Education | What is the average mathematics score in this year’s board exam? | All students who sat the specified exam this year. | One student. |
| Healthcare | How common is high blood pressure among adults in a city? | All adults living in the defined city during the study period. | One adult. |
| Business | How satisfied are the company’s customers? | Everyone who purchased from the company in the last 12 months. | One customer. |
| Manufacturing | What share of today’s light bulbs are faulty? | All bulbs produced on the specified day or production run. | One bulb. |
| Agriculture | What is the average wheat yield in a district? | All wheat farms in the defined district and season. | One farm. |
| Sports | What is a batter’s average runs per innings? | All innings played by that batter within the chosen period or competition. | One innings. |
| Environment | What is the level of pollution in a river? | Water at defined locations and times along the river. | One water sample or measurement point. |
The population changes when the research question changes. “All students in Pakistan” and “all Class 10 students in Sindh during 2026” are different populations, so they may lead to different results.
How to Define a Population: A Simple Checklist
Before collecting data, write a definition that answers these five questions:
- Who or what is being studied? Identify the unit, such as people, households, products, schools, or events.
- What characteristic makes a member eligible? State the inclusion criteria clearly.
- Where does the population exist? Specify the geographic or organizational boundary.
- When does the definition apply? Give the date, period, season, or academic year.
- Who is excluded, and why? Explain any deliberate exclusions.
| Definition quality | Example |
| Too vague | Smartphone users. |
| Clearly defined | Adults aged 18–35 living in Rawalpindi who used a smartphone daily during October 2026. |
The clearer definition makes it easier for another researcher to understand exactly who the results describe.
Population vs Sample
A population is the complete group of interest. A sample is a smaller group selected from that population and measured in the study. Researchers often analyze a sample because collecting information from every member may be too expensive, slow, or impractical.
| Feature | Population | Sample |
| Meaning | The entire group of interest. | A subset selected from the population. |
| Size symbol | N (capital letter). | n (small letter). |
| Numerical descriptions | Parameters. | Statistics. |
| Mean symbol | μ (mu). | x̄ (x-bar). |
| Standard deviation symbol | σ (sigma). | s. |
| Proportion symbol | P. | p̂ (p-hat). |
| How it is measured | A census measures every member. | A survey or study measures selected members. |
| Uncertainty | A complete, accurate census has no sampling error. | Sample estimates are subject to sampling error. |
| Example | All 2 million university students in a country. | 1,500 students selected for a survey. |
A useful memory aid is: population goes with parameter, while sample goes with statistic. A sample statistic can be used to estimate an unknown population parameter.
For a fuller explanation of how sample data supports conclusions about a wider group, read our guide to inferential statistics. Check that this target page is published and live before making the link active.
Census or Sample: Which Should You Use?
A census collects information from every member of the defined population. A sample study collects information from only part of it.
| Approach | Advantages | Limitations |
| Census | Can provide a complete count for the defined population; useful for small groups and official population counts. | Can be expensive, slow, difficult to organize, and still affected by non-sampling errors such as non-response or measurement mistakes. |
| Sample | Usually faster and less expensive; can produce useful estimates when sampling is designed carefully. | Subject to sampling error; may not represent the population if selection or response is biased. |
The ABS explains the distinction in its guide to census and sample.
- A census may be appropriate when the population is small and reachable, such as all 30 employees in one office.
- A sample is often more practical when the population is large, geographically spread out, or when testing every item would destroy it, as in crash-testing vehicles.
Same Topic, Different Populations
| Research question | Population | Possible sample |
| Average height of Class 9 girls in a city | All Class 9 girls in that city during the defined school year. | 300 girls selected from 15 randomly chosen schools. |
| Battery life of a phone model | All phones of that model produced under the defined manufacturing conditions. | 50 phones selected from different production batches. |
| Voter support for a policy | All registered voters in the defined election area. | 2,000 voters selected using a suitable polling design. |
A sample is useful only when the selection process supports the conclusions researchers want to make. A large sample alone does not guarantee that it represents the population.
Common Mistakes When Defining a Population
- Being too vague: “people who like tea” does not specify location, time, or eligibility.
- Confusing the population with the sample: the 500 people surveyed are the sample, not the full population.
- Generalizing to the wrong group: a survey of university students in Lahore does not automatically represent all young adults in Pakistan.
- Ignoring the target-accessible gap: results from hospital patients may not represent people who never visit those hospitals.
- Forgetting time: customers from five years ago may not represent current customers.
- Mixing up symbols: μ and σ describe a population; x̄ and s describe a sample.
Frequently Asked Questions
What is a population in statistics in simple words?
It is the whole group a study wants to learn about. The group may consist of people, objects, events, or measurements.
Does a population always mean people?
No. It can include products from a factory, trees in a forest, exam results, or daily temperature readings.
What is the difference between a population and a sample?
The population is the complete group of interest. A sample is a smaller part that researchers actually measure.
What is a population parameter?
A numerical value that describes the whole population, such as its mean (μ), standard deviation (σ), or proportion (P).
What is the difference between finite and infinite populations?
A finite population has a fixed, countable size. An infinite population is unlimited in the theoretical model or process being studied.
Why do researchers not always study the whole population?
A census may be too costly, slow, or impractical. A carefully selected sample can provide useful information more efficiently.
Can one population be both finite and a target population?
Yes. These labels describe different features. A target population can also be finite, existent, or belong to another category.
Conclusion
A population is the complete group a statistical study aims to understand. It should be defined using clear criteria, place, and time. Populations may be finite or theoretically infinite, real or hypothetical, and the group a researcher wants to study may be larger than the group they can actually reach.
Defining the population correctly is an essential first step. Once the group is clear, researchers can decide whether to conduct a census or select a sample. Any conclusions should be limited to the population the study was designed to represent.
References and Further Reading
- Australian Bureau of Statistics — What Statistics Are
- Australian Bureau of Statistics — Census and Sample
- Penn State — Samples and Populations (Introductory Statistics)
- NIST/SEMATECH e-Handbook of Statistical Methods
Disclaimer
This article is for general educational purposes. Examples are illustrative and use simplified scenarios. Definitions and notation may vary slightly across textbooks and examination boards, so follow the conventions required by your course. For professional research or survey design, consult a qualified statistician.