

Imagine two buses that both arrive at your stop at 8:00 a.m. on average. Bus A is almost always there between 7:58 and 8:02. Bus B sometimes arrives at 7:45 and sometimes at 8:20.
Quick Info
| Topic | Detail |
|---|---|
| What it is | A measure showing how spread out values are around the mean |
| What it measures | Data spread or variability |
| Symbols | σ (sigma) for a population; s for a sample |
| Small SD means | Values are close to the mean and relatively consistent |
| Large SD means | Values are widely scattered and less consistent |
| Smallest possible value | 0, when every value is identical |
| Units | Same as the original data, such as marks, cm, dollars, or minutes |
| Reading time | About 10 minutes |
Both have the same average arrival time, but only one is reliable enough to plan your morning around.
That difference, how much values vary around their average, is exactly what standard deviation helps measure. It is one of the most widely used statistical measures, appearing in everything from exam results and weather forecasts to factory quality checks and investment analysis.
Standard deviation also has a reputation for being difficult. However, the basic idea is easier to understand than its formula might suggest.
In this guide, you’ll learn what data spread means, how to calculate standard deviation step by step, and how to interpret the result. Each example uses manageable numbers that you can check with a basic calculator.
What Is Standard Deviation?
Standard deviation (SD) is a statistical measure that describes how spread out the values in a data set are around their mean.
A small standard deviation means most values are relatively close to the average. A large standard deviation means the values are more widely spread out.
The NIST/SEMATECH e-Handbook of Statistical Methods classifies standard deviation alongside range and variance as a measure of scale. These measures describe the spread of data rather than its centre.
One useful feature of standard deviation is that it uses the same units as the original data. For example, if your measurements are in centimetres, the standard deviation is also expressed in centimetres.
What Does Data Spread Mean?
The mean tells you where the centre of your data is. Spread describes how far the individual values vary around that centre.
If you are not familiar with the mean, start with our guide on what a mean is in statistics. Understanding it makes standard deviation much easier because the calculation begins with the mean.
Consider these two sets of quiz scores. Both classes have an average score of 70.
| Class | Scores | Mean | Data Distribution |
|---|---|---|---|
| A | 68, 69, 70, 71, 72 | 70 | Values are close to 70 |
| B | 40, 55, 70, 85, 100 | 70 | Values are spread far from 70 |
The mean cannot show the difference between these two classes. However, standard deviation can.
Class A has a small standard deviation because its scores are close together. Class B has a much larger standard deviation because its scores vary considerably.
We’ll calculate both values in the examples below.
Why Not Just Use the Range?
The range also measures spread, but it only considers two values: the highest and lowest observations.
One unusual value can change the range significantly.
Standard deviation uses every observation in the data set when measuring variation around the mean. This makes it a more comprehensive measure of spread, although it is also sensitive to extreme values.
For a closer comparison, see our guide on what range means in statistics.
How to Calculate Standard Deviation
The standard deviation formula may look complicated at first, but it follows a logical process.
There are two main formulas: one for a population and another for a sample.
Population Standard Deviation Formula
Use this formula when your data includes every member of the group you want to study:
[
\sigma=\sqrt{\frac{\sum(x-\mu)^2}{N}}
]
Sample Standard Deviation Formula
Use this formula when your data represents only a sample of a larger population:
[
s=\sqrt{\frac{\sum(x-\bar{x})^2}{n-1}}
]
What Do the Symbols Mean?
| Symbol | Meaning |
|---|---|
| σ (sigma) | Population standard deviation |
| s | Sample standard deviation |
| x | Each individual value |
| μ | Population mean |
| x̄ | Sample mean |
| N | Number of values in a population |
| n | Number of values in a sample |
| Σ | Add all the indicated values together |
The Five Steps to Calculate Standard Deviation
Follow these five steps to calculate standard deviation manually.
- Find the mean. Add all the values and divide the total by the number of observations.
- Find each deviation. Subtract the mean from every value using (x − mean). Some results will be negative, which is completely normal.
- Square each deviation. Multiply every deviation by itself. This makes all the results non-negative.
- Calculate the variance. Add the squared deviations and divide by N for a population or n − 1 for a sample.
- Take the square root. Find the square root of the variance. The result is the standard deviation.
The process may involve several calculations, but each step has a specific purpose.
Variance vs Standard Deviation
Variance and standard deviation are closely related, but they are not the same thing.
Variance is calculated by averaging the squared deviations from the mean. Standard deviation is the square root of that variance.
For example, if the variance is 25, the standard deviation is:
[
\sqrt{25}=5
]
Variance is expressed in squared units, such as cm² or marks². Standard deviation returns the result to the original units, making it easier to interpret.
Population or Sample: Which Formula Should You Use?
The correct formula depends on the data you are analysing.
- Population formula: Use N when your data includes every member of the group being studied. For example, if you are analysing the exam results of every student in one class, you have the complete class data.
- Sample formula: Use n − 1 when your data represents only part of a larger population. For example, if you survey 50 students from a university with thousands of students, you have a sample.
The n − 1 adjustment is known as Bessel’s correction. It corrects the tendency of sample variance to underestimate population variance.
The resulting sample standard deviation is generally larger than the population-style calculation using n. However, it is important to note that this correction makes the sample variance an unbiased estimator, not the sample standard deviation itself.
For school exercises, follow the formula specified by your textbook, teacher, or examination board.
Simple Numerical Examples
Let’s work through several examples to understand how standard deviation works in different situations.
Example 1: The Classic Eight Numbers
Find the population standard deviation of:
2, 4, 4, 4, 5, 5, 7, 9
Step 1: Calculate the mean.
Mean = (2 + 4 + 4 + 4 + 5 + 5 + 7 + 9) ÷ 8
Mean = 40 ÷ 8 = 5
Steps 2 and 3: Calculate and square each deviation.
| Value (x) | x − 5 | (x − 5)² |
|---|---|---|
| 2 | −3 | 9 |
| 4 | −1 | 1 |
| 4 | −1 | 1 |
| 4 | −1 | 1 |
| 5 | 0 | 0 |
| 5 | 0 | 0 |
| 7 | 2 | 4 |
| 9 | 4 | 16 |
| Total | 0 | 32 |
Notice that the deviations add up to zero. This happens because the mean balances the positive and negative deviations.
Squaring the deviations prevents them from cancelling each other out.
Step 4: Calculate the population variance.
Variance = 32 ÷ 8 = 4
Step 5: Calculate standard deviation.
SD = √4 = 2
The population standard deviation is 2.
This tells us that the values have a typical spread of about 2 units around their mean of 5.
Example 2: Same Mean, Different Spread
Let’s return to our two classes, which both have a mean score of 70.
Class A: 68, 69, 70, 71, 72
- Mean = 70
- Deviations = −2, −1, 0, 1, 2
- Squared deviations = 4, 1, 0, 1, 4
- Total squared deviations = 10
- Variance = 10 ÷ 5 = 2
- SD = √2 ≈ 1.41 marks
Class B: 40, 55, 70, 85, 100
- Mean = 70
- Deviations = −30, −15, 0, 15, 30
- Squared deviations = 900, 225, 0, 225, 900
- Total squared deviations = 2,250
- Variance = 2,250 ÷ 5 = 450
- SD = √450 ≈ 21.21 marks
Both classes have the same average, but Class B has a much larger standard deviation.
Its standard deviation is approximately 15 times as large as Class A’s. This shows how differently the scores are distributed despite having identical averages.
Example 3: Sample Standard Deviation
A shop owner checks daily sales on five randomly selected days. The number of units sold is:
6, 8, 10, 12, 14
Because these are only five selected days from a larger number of trading days, we use the sample standard deviation formula.
Step 1: Calculate the mean.
Mean = (6 + 8 + 10 + 12 + 14) ÷ 5
Mean = 50 ÷ 5 = 10
Step 2: Calculate the deviations.
−4, −2, 0, 2, 4
Step 3: Square the deviations.
16, 4, 0, 4, 16
Total = 40
Step 4: Calculate the sample variance.
Sample variance = 40 ÷ (5 − 1)
= 40 ÷ 4 = 10
Step 5: Calculate the sample standard deviation.
s = √10 ≈ 3.16 units
The sample standard deviation is approximately 3.16 units.
For comparison, if these five days represented the entire population being studied, the population standard deviation would be:
√(40 ÷ 5) = √8 ≈ 2.83 units
Example 4: Which Batsman Is More Consistent?
Two batsmen each average 50 runs over five matches.
| Batsman | Scores | Mean | Sum of Squared Deviations | Population SD |
|---|---|---|---|---|
| A | 45, 50, 52, 48, 55 | 50 | 58 | √(58 ÷ 5) ≈ 3.41 runs |
| B | 5, 90, 12, 110, 33 | 50 | 8,958 | √(8,958 ÷ 5) ≈ 42.33 runs |
Batsman A scores within a relatively small range around 50 runs in each match.
Batsman B has much greater variation. One match might produce a very high score, while another might result in only a few runs.
A team selector looking for consistent performance would find Batsman A’s results more predictable.
This example shows why the average alone does not always provide enough information when comparing performance.
Example 5: When Every Value Is the Same
Find the standard deviation of:
7, 7, 7, 7
- Mean = 7
- Every deviation = 0
- Every squared deviation = 0
- Variance = 0
- Standard deviation = 0
A standard deviation of zero means there is absolutely no variation in the data.
It is the smallest possible standard deviation. Standard deviation can never be negative.
Example 6: Adding a Constant Does Not Change the Spread
Take the values from Example 1 and add 10 to every observation.
Original data:
2, 4, 4, 4, 5, 5, 7, 9
New data:
12, 14, 14, 14, 15, 15, 17, 19
The new mean is 15, which is 10 higher than the original mean of 5.
However, the deviations remain exactly the same:
−3, −1, −1, −1, 0, 0, 2, 4
The squared deviations still add up to 32.
Therefore:
SD = √(32 ÷ 8) = 2
Adding the same constant to every value changes the mean but does not change the standard deviation.
This happens because the distance between each value and the mean stays the same.
How to Interpret Standard Deviation
Calculating standard deviation is only part of the process. You also need to understand what the result tells you.
Small vs Large Standard Deviation
| Feature | Small SD | Large SD |
|---|---|---|
| Distance from the mean | Values are relatively close | Values are more widely spread |
| Data consistency | More consistent | Less consistent |
| Predictability | Usually more predictable | Usually less predictable |
| Everyday example | A bus that arrives at nearly the same time | A bus with widely varying arrival times |
| Sports example | Batsman A in Example 4 | Batsman B in Example 4 |
There is no universal rule that makes a particular standard deviation good or bad.
For example, an SD of 5 might be small when analysing house prices measured in thousands of dollars but extremely large when measuring the weight of a medicine tablet in milligrams.
Always interpret standard deviation in relation to the mean, the units, and the subject being studied.
Relative Spread: Comparing Standard Deviation with the Mean
Sometimes, comparing standard deviations directly is not enough. You may also need to consider the size of the average.
A useful statistical measure for this is the coefficient of variation (CV).
Its formula is:
[
CV=\frac{s}{\bar{x}}\times100%
]
For population data, the corresponding formula uses σ and μ.
Using the two classes from Example 2:
Class A:
CV = (1.41 ÷ 70) × 100 ≈ 2.01%
Class B:
CV = (21.21 ÷ 70) × 100 ≈ 30.30%
Class B has a much greater relative spread than Class A.
The coefficient of variation is particularly useful when comparing variability between data sets with different means or measurement scales. It is most appropriate when the data has a meaningful, positive zero and the mean is not zero.
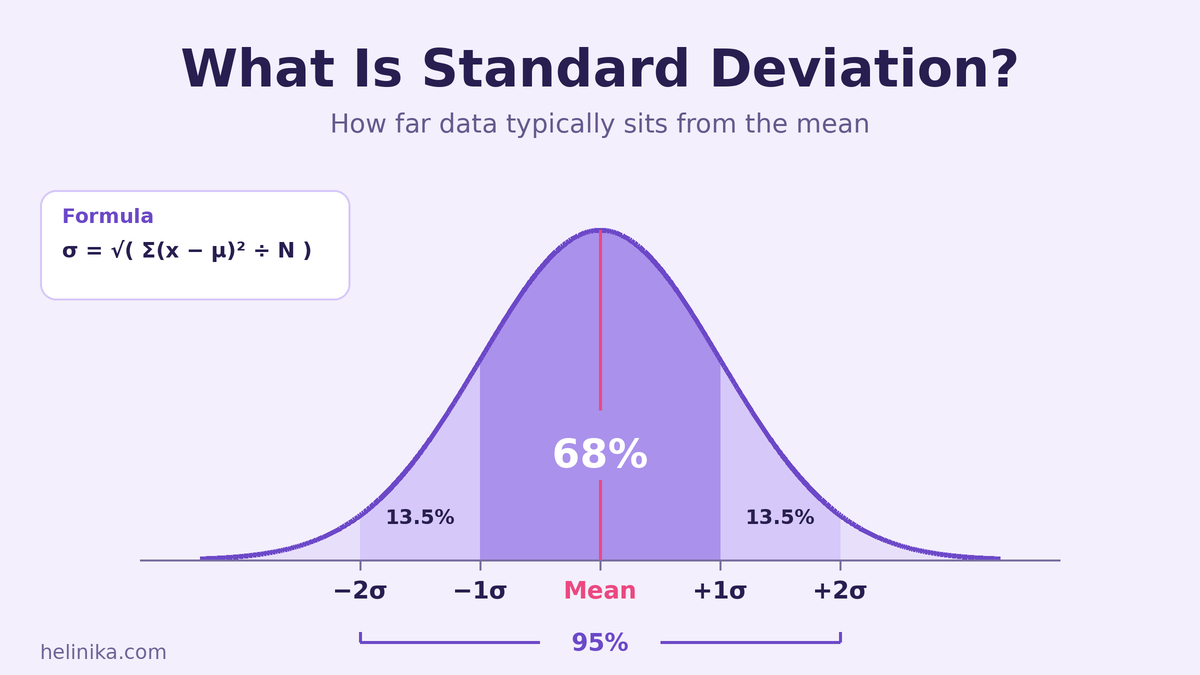
The 68–95–99.7 Rule
When data follows an approximately normal, bell-shaped distribution, standard deviation provides additional information about where observations are likely to fall.
This pattern is called the 68–95–99.7 rule, or the empirical rule.
| Distance from the Mean | Approximate Percentage of Data |
|---|---|
| Mean ± 1 SD | 68% |
| Mean ± 2 SD | 95% |
| Mean ± 3 SD | 99.7% |
Let’s consider a board exam where the mean score is 60 and the standard deviation is 8. Assume the marks follow an approximately normal distribution.
- About 68% of students score between 52 and 68 (60 ± 8).
- About 95% score between 44 and 76 (60 ± 16).
- About 99.7% score between 36 and 84 (60 ± 24).
What if a student scores 80?
Their score is:
(80 − 60) ÷ 8 = 2.5 standard deviations above the mean.
Under a normal distribution, approximately 0.6% of students would score above this level.
This makes 80 a particularly high score compared with the rest of the class.
Important: The empirical rule only applies when the data follows an approximately normal, bell-shaped distribution. It should not automatically be used for heavily skewed or irregular data sets.
Standard Deviation vs Range
Both standard deviation and range measure data spread, but they approach the calculation differently.
| Feature | Standard Deviation | Range |
|---|---|---|
| Values used | Every observation | Only highest and lowest |
| Calculation | Several steps | One subtraction |
| Outlier sensitivity | Sensitive to extreme values | Highly sensitive to extreme values |
| What it describes | Variation around the mean | Distance between extremes |
| Best suited for | Detailed statistical analysis | Quick comparisons |
The range is easier to calculate, while standard deviation provides a more detailed picture of variation around the mean.
When Standard Deviation Can Be Misleading
Standard deviation is useful, but it does not describe every data set equally well.
The Australian Bureau of Statistics’ guide to standard deviation explains that standard deviation is affected by extreme observations and is most useful when data is reasonably regularly distributed.
There are two situations where you should be particularly careful:
- Extreme values: An unusually large or small observation can increase standard deviation considerably because the deviations are squared.
- Highly skewed data: When most observations are concentrated on one side and a few are far away, standard deviation may not describe the typical spread very well.
For such data, the median and interquartile range may provide a more useful summary.
Common Mistakes to Avoid
Students often make small mistakes when calculating standard deviation. Here are some common ones to avoid:
- Forgetting to square the deviations: Without squaring, positive and negative deviations cancel each other out.
- Stopping at variance: Remember to take the square root after calculating variance.
- Mixing up N and n − 1: Use the population formula for a complete population and the sample formula for a sample.
- Rounding the mean too early: Keep the full calculated value until the final answer whenever possible.
- Thinking standard deviation can be negative: It can be zero, but it cannot be negative.
- Ignoring the units: Standard deviation uses the same units as the original observations.
- Interpreting SD without context: A particular value may be small in one situation and large in another.
Where Standard Deviation Is Used in Real Life
Standard deviation is used in many fields because it helps people understand variation and consistency.
- Education: Teachers compare how consistently students perform across exams and classes.
- Weather: Meteorologists examine how much temperatures vary around average conditions.
- Manufacturing: Factories monitor variations in product measurements to maintain quality.
- Finance: Analysts use standard deviation to measure investment price volatility.
- Sports: Coaches compare the consistency of players rather than relying only on average performance.
- Healthcare: Researchers examine variation in medical measurements and test results across groups of people.
In each situation, standard deviation provides useful information about how much observations vary.
Frequently Asked Questions
What is standard deviation in simple words?
Standard deviation is a number that describes how spread out values are around their average. A small value means observations are close to the mean, while a large value indicates greater variation.
What does a high standard deviation mean?
A high standard deviation means the values are more widely scattered around the mean. This usually indicates greater variability and less consistency.
Can standard deviation be zero or negative?
Standard deviation can be zero when every value in a data set is identical. However, it can never be negative because it is calculated using squared deviations and a square root.
What is the difference between variance and standard deviation?
Variance measures the average squared deviation from the mean, while standard deviation is the square root of variance. Standard deviation is easier to interpret because it uses the original measurement units.
When should I divide by n − 1 instead of N?
Use n − 1 when calculating sample variance and sample standard deviation from a sample of a larger population. Use N when your data covers the entire population being studied.
Is standard deviation affected by outliers?
Yes. Standard deviation is sensitive to outliers because it squares the distance between each value and the mean. An unusually high or low value can significantly increase the result.
What is the smallest possible standard deviation?
The smallest possible standard deviation is zero. This occurs when all observations have exactly the same value.
Is a low standard deviation always better?
Not necessarily. A low standard deviation means the data is more consistent, but whether that is desirable depends on the situation.
For example, consistent manufacturing measurements are usually desirable, while variation in scientific research may provide important information.
Conclusion
Standard deviation answers an important question that the average alone cannot: how much does the data vary?
To calculate it, find the mean, measure how far each value is from that mean, square the deviations, calculate the variance, and take the square root.
The result helps you understand whether observations are closely grouped or widely scattered. It is useful for comparing exam results, analysing sports performance, monitoring manufacturing quality, and studying financial volatility.
Once you understand the calculation, focus on interpreting the result. Consider the mean, the units, and the shape of the data. For approximately normal distributions, the 68–95–99.7 rule provides another useful way to understand standard deviation.
Remember that outliers and heavily skewed data can affect the result. When that happens, consider other measures of spread, such as the interquartile range.
References
- NIST/SEMATECH e-Handbook of Statistical Methods – Measures of Scale
- Australian Bureau of Statistics – Using Standard Deviation, Standard Error and Relative Standard Error
Disclaimer
This article is for general educational purposes only. All examples use simplified, illustrative data to explain statistical concepts. Formulas, notation, and rounding conventions can vary between textbooks and examination boards, so follow your teacher’s or syllabus guidelines when preparing for exams. For research, financial analysis, or professional statistical work, consult a qualified statistician.