

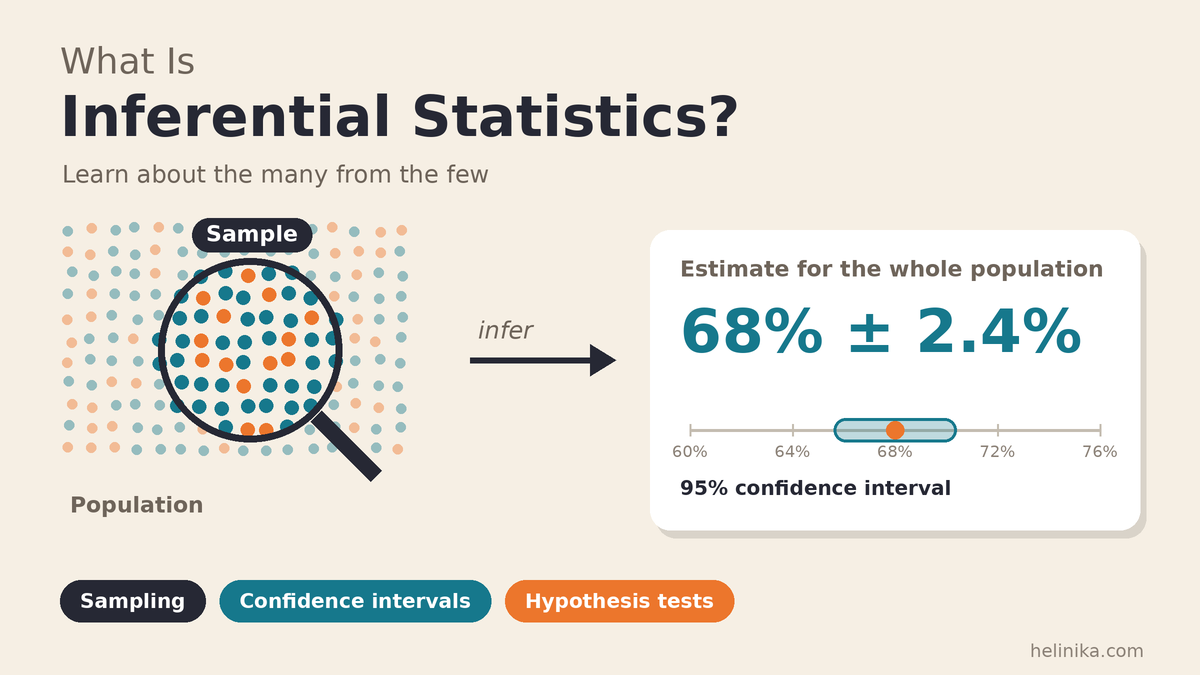
A cook tastes one spoonful of soup to decide whether the whole pot needs more salt. The cook does not test every spoonful; the sample provides clues about the entire pot. Inferential statistics uses a similar idea: it analyzes information from a sample to make estimates or test claims about a larger population.
If you are new to the subject, start with our guide to what statistics is, which explains how descriptive and inferential statistics fit together. This article focuses on samples, confidence intervals, hypothesis tests, and practical examples.
You will also learn why sampling methods matter, what a p-value means, and why conclusions from a sample should include an appropriate measure of uncertainty.
What Is Inferential Statistics?
Inferential statistics is the branch of statistics that uses data from a sample to estimate, predict, or test claims about a larger population. Because a sample may differ from the population, inferential methods use probability to describe uncertainty.
Descriptive statistics summarizes the data that has been collected; inferential statistics uses sample data to learn about a wider group. A useful inference depends on a suitable sample and an honest account of uncertainty, often expressed through a confidence interval, margin of error, or p-value.
For example, if 68% of surveyed university students own a laptop, inferential statistics helps estimate the proportion among all university students. The survey result is an estimate, not a guarantee.
Population and Sample: The Starting Point
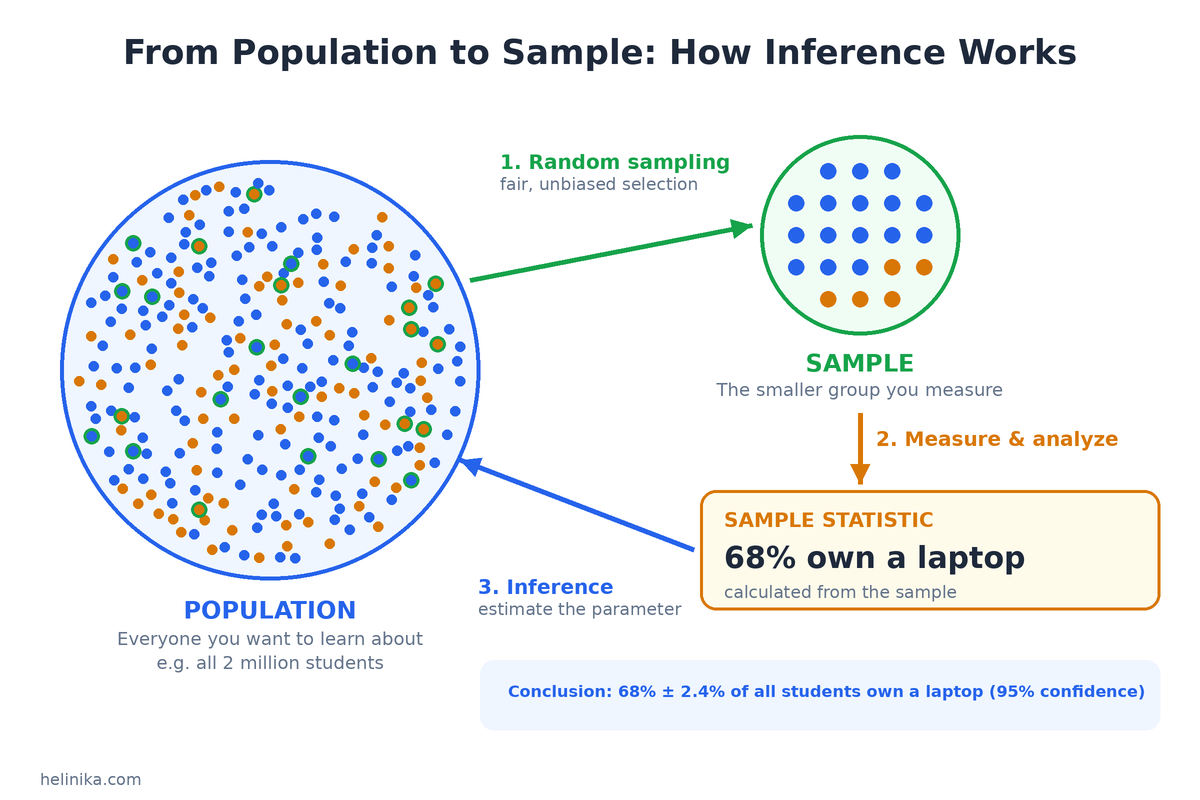
The population is the complete group a researcher wants to understand. The sample is the smaller group from which data is actually collected.
| Term | Meaning | Example |
| Population | The complete group a study aims to describe. | All university students in a country. |
| Sample | The people or items actually measured. | 1,500 students selected for a survey. |
| Parameter | A numerical value describing the population, usually unknown. | The true percentage of all students who own a laptop. |
| Statistic | A numerical value calculated from the sample. | 68% of the surveyed students own a laptop. |
The goal is to use a sample statistic to estimate or test a claim about the population parameter.
Why Not Measure Everyone?
Measuring every member of a population is called a census. A census can be useful, but it may be impractical when the population is large or testing is expensive, slow, or destructive.
- Cost: surveying millions of people may require substantial time and money.
- Time: collecting information from everyone may take too long for a decision that is needed soon.
- Practical limits: testing every product may damage or consume the items being tested, as in some quality-control processes.
A carefully selected sample can provide useful information more efficiently. Its value depends on the selection method and the research question.
How Are Samples Chosen?
Sampling is the process of selecting people, objects, or observations for a study. Common methods include:
| Method | How it works | Example |
| Simple random sampling | Each population member has a known, equal chance of selection. | Randomly selecting 100 student IDs from a list of 2,000. |
| Stratified sampling | Divide the population into subgroups, then randomly sample from each. | Selecting students from each province in proportion to its population. |
| Cluster sampling | Randomly select groups, then study members within selected groups. | Selecting 20 schools at random and surveying their teachers. |
| Systematic sampling | Choose a random start and then every kth member. | Selecting every 10th customer after a random start. |
| Convenience sampling | Select people who are easiest to reach; this can create bias. | Asking only friends to complete a survey. |
Researchers should also consider non-response, missing data, the sampling frame, and whether the sample represents the population they want to describe.
Sampling Error and Bias
- Sampling error is the natural difference between a sample result and the population value. It can occur even when sampling is conducted properly. For many common designs, increasing sample size reduces random variation.
- Bias is a systematic problem caused by how data is selected, collected, or measured. An online-only survey, for example, may miss people who rarely use the internet. A larger sample does not automatically remove bias.
A large biased sample can produce a misleading result. Good sampling design and accurate measurement are as important as sample size.
The Two Main Methods of Inferential Statistics
Inferential statistics is commonly used for two broad purposes: estimating an unknown population value and testing a claim about that value.
Method 1: Estimation
Estimation asks: what value is plausible for the population, based on the sample?
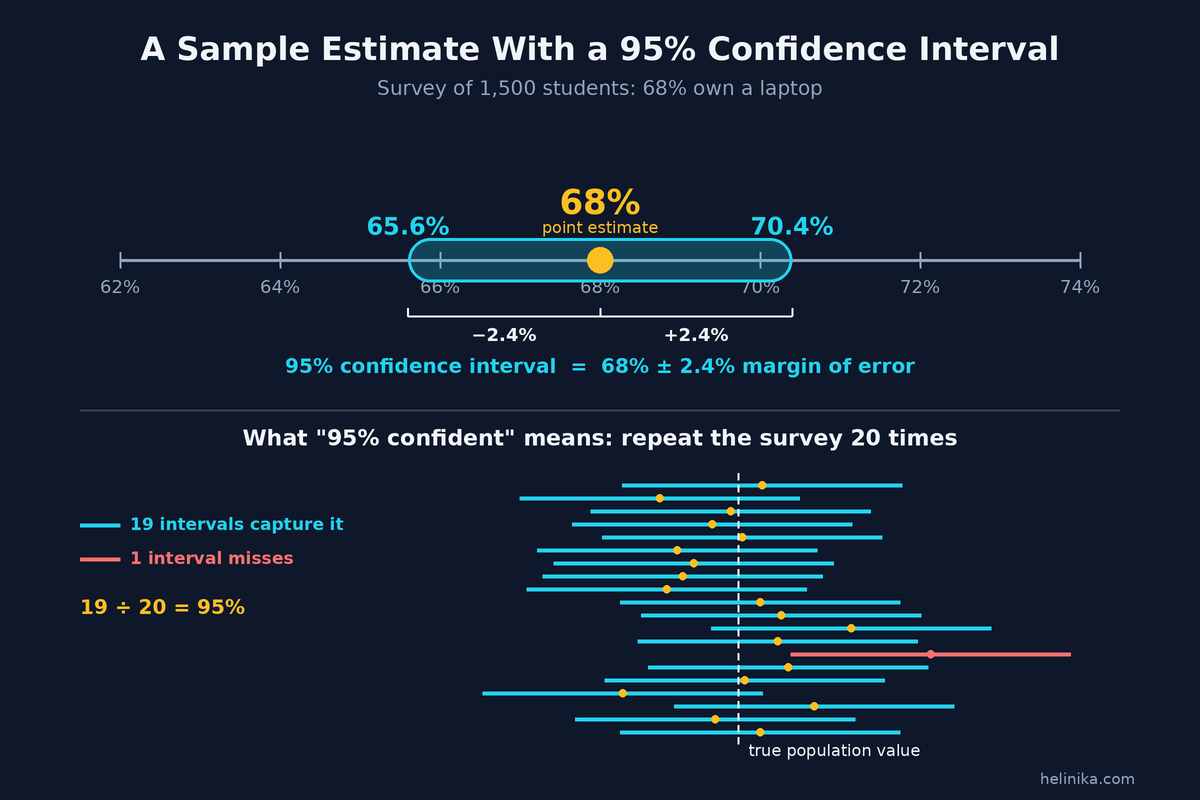
- Point estimate: a single value calculated from the sample. If 68% of surveyed students own a laptop, 68% is the sample proportion and a point estimate of the population proportion.
- Interval estimate: a range of plausible values that communicates uncertainty. A confidence interval is a widely used type of interval estimate.
For a sample proportion, a commonly taught large-sample approximate 95% confidence interval is:
p̂ ± 1.96 × √[p̂(1 − p̂) / n]
For a population mean when the population standard deviation is unknown, a t-based interval is generally used:
x̄ ± t* × (s / √n)
Here, p̂ is the sample proportion, x̄ is the sample mean, s is the sample standard deviation, n is sample size, and t* is the appropriate critical value. The exact method depends on the study design and assumptions. See NIST’s guide to confidence limits for the mean for details.
What Does a 95% Confidence Level Mean?
A 95% confidence level describes the long-run performance of the method. If researchers repeatedly took samples in the same way and built an interval from each sample, about 95% of those intervals would contain the true population value. It does not mean there is a 95% probability that one already-calculated interval contains the fixed population value.
Read the NIST explanation of confidence intervals for a technical explanation.
- Larger samples usually produce narrower intervals, all else being equal. For a simple proportion estimate, roughly four times the sample size is needed to halve the margin of error.
- More variation in the data generally produces wider intervals, meaning less precision.
Method 2: Hypothesis Testing
Hypothesis testing uses sample data to evaluate a claim about a population. It does not prove a claim with absolute certainty; it assesses whether the observed data would be unusual under a specified assumption.
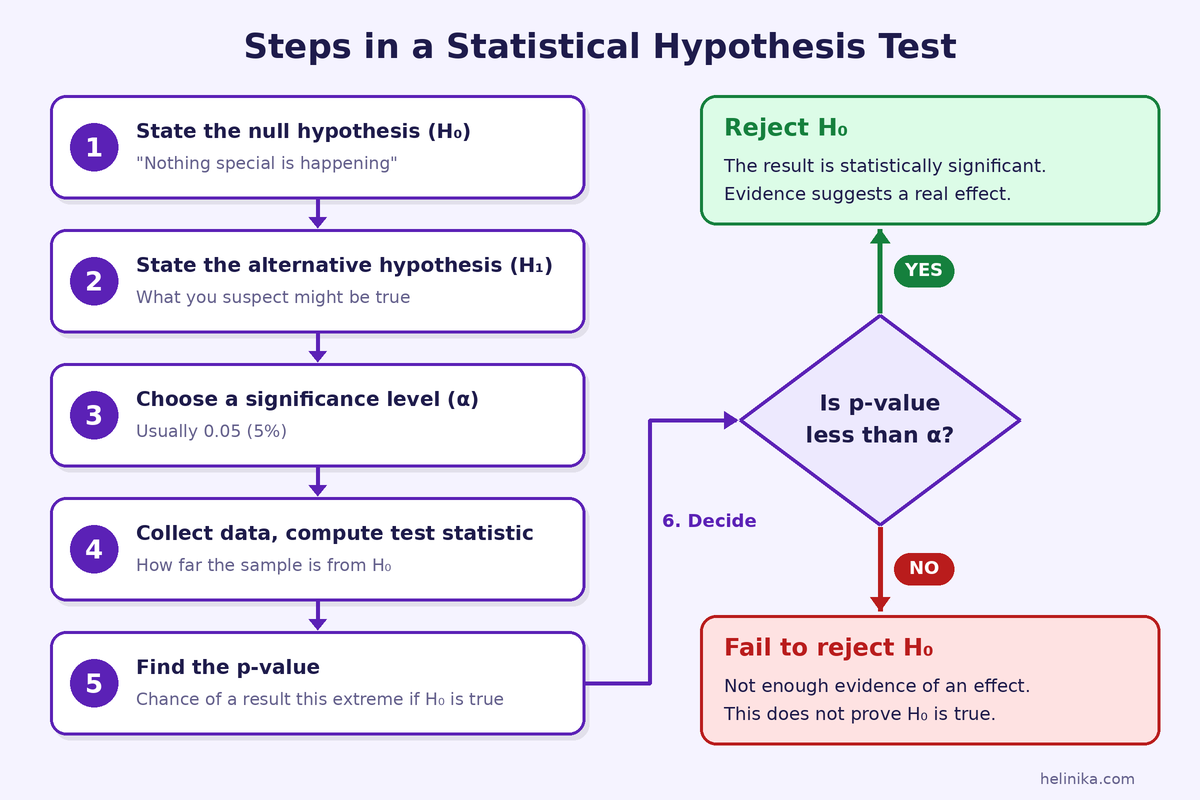
- State the null hypothesis (H₀), such as “the new teaching method does not change the average score.”
- State the alternative hypothesis (H₁), which represents the difference or effect being investigated.
- Choose a significance level (α), often 0.05, before analyzing the results.
- Collect data and calculate an appropriate test statistic.
- Calculate the p-value and compare it with the chosen significance level.
- Report the result in context, including the estimated effect and uncertainty—not just whether it crossed a threshold.
If the p-value is below α, researchers commonly reject the null hypothesis. If it is at or above α, they do not reject it. Not rejecting H₀ does not prove H₀ is true; it means the data did not provide sufficient evidence against it under the chosen test.
What Is a P-Value?
A p-value is the probability, assuming the null hypothesis and statistical model are correct, of obtaining a result at least as extreme as the one observed. A small p-value indicates that the result would be relatively unusual under the null hypothesis.
A p-value is not the probability that the null hypothesis is true, and it does not measure how large or practically important an effect is. Consider the effect size, study design, sample size, and uncertainty as well.
For a technical overview, see the NIST discussion of hypothesis testing.
Two Types of Errors in Hypothesis Testing
Because a test uses sample data, its decision can be wrong. A Type I error occurs when a true null hypothesis is rejected (a false positive). A Type II error occurs when a false null hypothesis is not rejected (a false negative).
| Decision | H₀ is true | H₀ is false |
| Reject H₀ | Type I error (false positive) | Correct decision |
| Do not reject H₀ | Correct decision | Type II error (false negative) |
In a simplified medical-screening analogy, a false positive may incorrectly flag a healthy person, while a false negative may fail to flag a condition that is present. Actual medical testing requires more careful interpretation.
How Confidence Intervals and Hypothesis Tests Connect
Confidence intervals and hypothesis tests are closely related. For a two-sided test at the 5% significance level, the corresponding 95% confidence interval and test generally agree about whether the hypothesized parameter value is compatible with the data, provided they use matching assumptions and methods.
See the NIST explanation of the relationship between a test and a confidence interval.
A confidence interval often provides more information than a significant/not-significant decision because it shows plausible values and helps communicate the size and precision of an effect.
Worked Examples of Inferential Statistics
Example 1: Estimating a Percentage From a Survey
Suppose a researcher randomly selects 1,500 university students and finds that 1,020 own a laptop. The sample proportion is 1,020 ÷ 1,500 = 0.68, or 68%.
- Point estimate: 68%.
- Standard error using the large-sample approximation: √(0.68 × 0.32 ÷ 1,500), approximately 0.012.
- Approximate 95% margin of error: 1.96 × 0.012, or about 2.4 percentage points.
- Approximate 95% confidence interval: 68% ± 2.4 points, or about 65.6% to 70.4%.
This is an illustrative calculation. In a real survey, researchers should account for sampling design, non-response, weighting, and possible bias. A confidence interval does not correct a biased sample.
How Sample Size Affects Margin of Error
For a simple random sample and a proportion near 50%, the approximate 95% margin of error changes as sample size increases:
| Sample size | Approximate margin of error |
| 100 | ±9.8 percentage points |
| 400 | ±4.9 percentage points |
| 1,000 | ±3.1 percentage points |
| 1,500 | ±2.5 percentage points |
| 2,500 | ±2.0 percentage points |
These are simplified estimates for a proportion near 50%, using a simple random sample and ignoring design effects and non-response. Real surveys may have wider uncertainty.
Example 2: Testing a Packaging Claim
Imagine a rice brand states that its bags contain an average of 5 kg. A consumer group randomly selects 100 bags and measures an average weight of 4.96 kg, with a sample standard deviation of 0.15 kg.
- Null hypothesis: the population mean bag weight is 5 kg.
- Alternative hypothesis: the population mean bag weight is different from 5 kg.
- The sample mean is 4.96 kg, which is 0.04 kg (40 grams) below the stated value.
Using a large-sample t-based 95% interval with 99 degrees of freedom gives an approximate interval of 4.930 to 4.990 kg. Since 5 kg is outside this interval, the sample provides evidence that the population mean differs from 5 kg at the 5% level, under the test assumptions.
This is a simplified teaching example. In an actual quality-control investigation, researchers should check the sampling process, scale calibration, measurement variation, and whether the claim concerns an average or every individual bag.
Example 3: Comparing Two Website Designs (A/B Test)
An online store randomly assigns visitors to one of two website designs. Design A is shown to 1,000 visitors and produces 120 purchases. Design B is shown to another 1,000 visitors and produces 150 purchases.
| Design | Visitors | Purchases | Conversion rate |
| A | 1,000 | 120 | 12% |
| B | 1,000 | 150 | 15% |
The observed difference is 3 percentage points in favor of Design B. A two-sided two-proportion test gives a p-value close to 0.05 (approximately 0.05, depending on the exact test and calculation). This is borderline evidence, not proof that Design B will always perform better.
Before making a business decision, consider the confidence interval for the difference, practical value of the lift, whether the test was planned in advance, and whether other factors affected visitors.
Common Inferential Statistical Tests
| Method | Question it can help answer | Example |
| One-sample t-test | Does a population mean differ from a specified value? | Is average fill weight different from 5 kg? |
| Two-sample t-test | Do two independent groups have different means? | Do two teaching groups have different average scores? |
| Paired t-test | Did the same participants change between two measurements? | Did students’ scores change after a course? |
| Proportion test | Do one or two population proportions differ? | Do two website versions have different conversion rates? |
| Chi-square test | Are categorical variables associated? | Is preferred sport associated with age group? |
| ANOVA | Do three or more group means differ? | Do three fertilizers produce different average crop yields? |
| Correlation and regression | How are variables associated, and can one help predict another? | Is study time associated with exam scores? |
The correct method depends on the research question, data type, study design, and assumptions. A test should not be selected only because it is familiar.
Assumptions Behind Inferential Statistics
- Sampling: the sample should be selected in a way that supports conclusions about the target population.
- Independence: observations should be independent where the method requires it. Clustered or repeated measurements need methods that account for their structure.
- Sample size: the amount of data should be adequate for the chosen analysis and the effect being studied.
- Model or distribution conditions: some tests rely on assumptions about data shape or errors. A histogram can help reveal skew or outliers.
For a visual check of a data distribution, see our guide to the histogram. A graph helps reveal patterns but does not replace all formal checks.
If important assumptions are violated, the result may be misleading. Researchers should explain the methods used and any limitations.
Limitations of Inferential Statistics
- It is not completely certain: sample-based conclusions always involve uncertainty.
- It depends on data quality: a biased sample or inaccurate measurement can mislead.
- Statistical significance is not practical importance: a tiny difference can be significant in a very large sample.
- A non-significant result does not prove there is no effect; the study may have too little information to detect it.
- Correlation does not establish causation: a relationship between variables does not, by itself, show that one causes the other.
Statistical findings should be interpreted alongside the research design, effect size, uncertainty, and context.
Common Mistakes to Avoid
- Treating a p-value as the probability that the null hypothesis is true.
- Saying a 95% confidence interval gives a 95% probability that the fixed population value is inside that one interval.
- Ignoring the margin of error or confidence interval when comparing percentages.
- Generalizing results beyond the population that was sampled.
- Running many tests and reporting only significant results; repeated testing can increase false positives.
- Assuming statistical significance automatically means a result matters in practice.
Where Is Inferential Statistics Used?
| Field | How it is used |
| Elections and public opinion | Opinion polls use samples to estimate support or public attitudes in a wider population. |
| Medicine | Clinical trials compare treatments and estimate uncertainty around outcomes. |
| Manufacturing | Quality-control teams inspect samples to assess whether production meets standards. |
| Business and marketing | A/B tests and customer research compare campaigns, prices, or website experiences. |
| Agriculture | Field trials compare seed varieties, fertilizers, or growing conditions. |
| Government and public planning | Household and labor surveys estimate measures such as employment and income. |
Frequently Asked Questions
What is inferential statistics in simple words?
It is the use of information from a carefully selected sample to estimate or test claims about a larger group, while explaining uncertainty.
What is the difference between a sample and a population?
The population is the full group a study aims to understand. The sample is the smaller group from which the researcher collects data.
What is a confidence interval?
It is a range calculated from sample data using a method with a stated confidence level. A 95% method captures the true value in about 95% of repeated samples, under its assumptions.
What does a p-value tell you?
It tells you how likely it would be to observe a result at least as extreme as the one obtained if the null hypothesis and model were correct.
Why is random sampling important?
A suitable random sampling method can reduce selection bias and support generalization to the target population. It does not eliminate every possible error.
How large should a sample be?
There is no single correct size. It depends on the population, study design, expected variation, desired precision, and effect the study aims to detect.
Conclusion
Inferential statistics helps researchers learn about a larger population by studying a sample. Its two central tasks are estimation—often reported with confidence intervals—and hypothesis testing, which evaluates claims using sample evidence.
The strength of an inference depends on how the sample was selected, the quality of the measurements, the statistical method, and how uncertainty is communicated. In opinion polls, medicine, manufacturing, or website experiments, good statistical reasoning explains not only what the data suggests but also how far the evidence can be trusted.
References and Further Reading
- NIST/SEMATECH e-Handbook — Confidence Limits for the Mean
- NIST/SEMATECH e-Handbook — What Are Confidence Intervals?
- NIST/SEMATECH e-Handbook — Relationship Between a Test and a Confidence Interval
- NIST/SEMATECH e-Handbook — Quantitative Techniques and Hypothesis Tests
- NIST/SEMATECH Engineering Statistics Handbook
Disclaimer
This article is for general educational purposes. Numerical examples are simplified teaching examples, not results from actual research studies. Formulas shown are common approximations and may not suit every sample design or dataset. For research, medical, business, or policy decisions, consult a qualified statistician or relevant professional.