

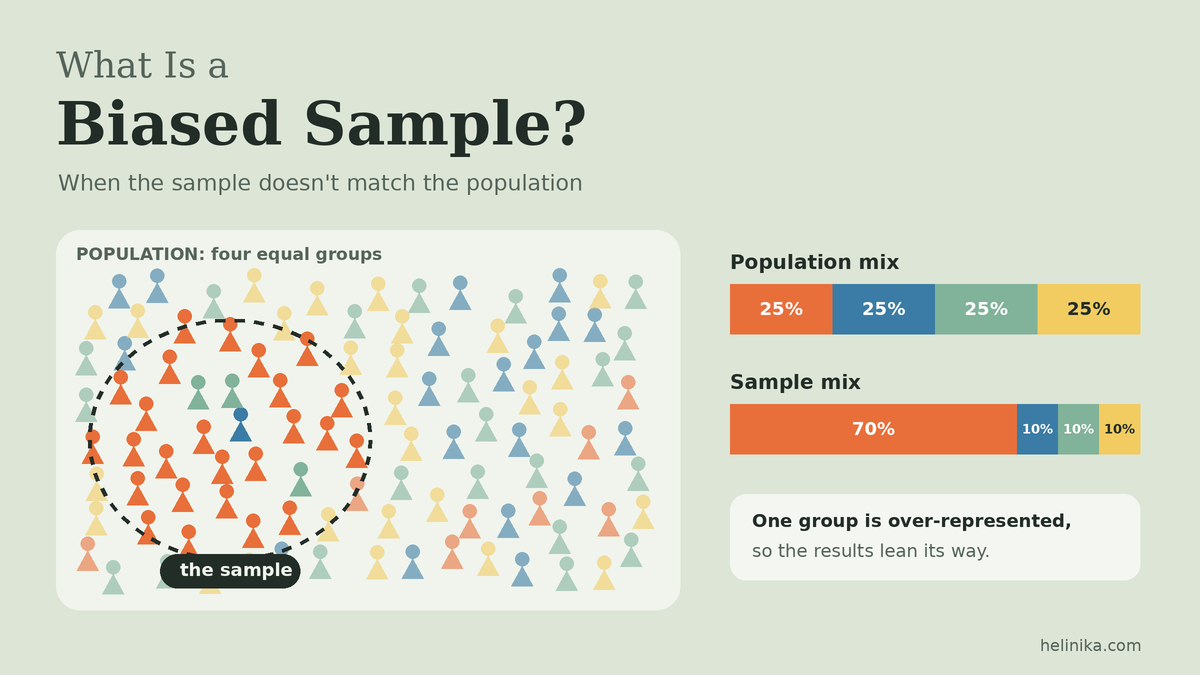
In a 2022 survey experiment, Pew Research Center asked people in an online opt-in poll whether they were licensed to operate a nuclear submarine. Among respondents under 30, 12% said yes. The real share of Americans with that license rounds to zero. Nobody made a calculation error; the poll simply collected answers from the wrong mix of people. That is what a biased sample does: it quietly tilts the data before any analysis begins.
A biased sample can make a product look more popular than it is, a policy look less supported than it is, or a health risk look smaller than it is. And because the numbers still look neat and precise, the problem is easy to miss. This article explains how bias gets into a sample, what it does to the results, how to tell whether a sample is biased, and what researchers can do about it.
Quick Info
| Topic | Detail |
|---|---|
| Short definition | A sample that systematically over- or under-represents parts of the population |
| Root cause | Some members of the population had a better or worse chance of ending up in the data |
| Key warning | A bigger sample does not fix bias; it just makes the wrong answer look more precise |
| Main entry points | The list used, how people are selected, who responds, and who drops out |
| Best protection | Random selection from a complete list, high response rates, and checking the sample against known population figures |
| Reading time | About 10 minutes |
What Is a Biased Sample?
A biased sample is a sample in which some members of the population are systematically more or less likely to be included than others, so the sample does not fairly represent the population it is meant to describe.
The key word is systematically. Every sample differs a little from its population just by chance. That random wobble is called sampling error, and it shrinks as the sample gets bigger. Bias is different: it pushes results in the same direction every time, and collecting more data the same way does not make it go away.
| Sampling error | Sampling bias | |
|---|---|---|
| What causes it | Chance: which members happen to be picked | A flaw in how members are reached or selected |
| Direction | Random: sometimes too high, sometimes too low | Consistent: always pushes the same way |
| Does a bigger sample help? | Yes, it shrinks | No, it stays |
| Can it be measured? | Yes, with a margin of error | Usually not from the sample alone |
In everyday language, “biased” means leaning unfairly toward one side. A referee who always favors the home team is biased. A biased sample works the same way: it favors certain voices over others, even when nobody intends it to.
Where Bias Gets Into a Sample
Most explanations give a long list of bias “types.” It’s more useful to ask where in the process things went wrong. Data passes through four gates on its way from the population to your spreadsheet, and bias can slip in at any of them.
Gate 1: The List (Coverage Bias)
Before anyone is chosen, researchers need a list or map of the population to choose from. If that list leaves people out, those people have zero chance of being sampled, no matter how carefully the selection is done later.
Example: A city surveys residents using a list of registered landline numbers. Younger renters who only use mobile phones aren’t on the list, so they can never be selected.
This is often called undercoverage.
Gate 2: The Selection (Selection Bias)
Even with a good list, bias appears when people are chosen by convenience, judgment or self-selection instead of by chance. Asking whoever is nearby, or letting people sign themselves up, favors those who are easy to reach or strongly motivated. Our guide to sampling methods explains why chance-based methods avoid this, and random sampling shows how to draw one properly.
Example: A fitness app invites users to rate their health. Only people who already exercise regularly bother to open the app, so the sample looks far healthier than the general public.
Gate 3: The Response (Nonresponse Bias)
A perfectly random sample can still go wrong if many of the chosen people don’t answer, and the ones who don’t answer differ from the ones who do.
Example: A random sample of 1,000 workers is invited to a survey about job satisfaction. Overworked employees are least likely to have time to reply, so the finished sample looks happier than the workforce really is.
A low response rate isn’t automatically fatal. What matters is whether non-responders are different in ways connected to the question.
Gate 4: Who Stays in the Data (Survivorship and Attrition Bias)
Sometimes the sample starts fine, but members drop out over time, or only the “survivors” are ever looked at.
Example: A study of successful small businesses interviews owners whose shops are still open after ten years. The businesses that failed aren’t in the sample at all, so the advice drawn from it (“take big risks!”) may be dangerously one-sided.
The Four Gates at a Glance
| Gate | What goes wrong | Typical name | Quick example |
|---|---|---|---|
| 1. The list | Some people can’t be selected at all | Coverage bias, undercoverage | Landline-only phone list |
| 2. The selection | Choosing by convenience or self-selection | Selection bias, voluntary response bias | Opt-in online poll |
| 3. The response | Chosen people don’t reply, and they differ | Nonresponse bias | Busy workers skip a survey |
| 4. Who stays | Drop-outs or failures vanish from the data | Survivorship bias, attrition bias | Studying only businesses that survived |
One more source is worth mentioning: response bias, where people are included correctly but answer inaccurately, because of a leading question or because they want to look good. Strictly, that’s a measurement problem rather than a sampling one, but it often travels with a biased sample and has the same effect: the numbers drift away from the truth.
Worked Example: How a Biased Sample Distorts the Answer
Numbers make the problem much clearer, so let’s build one simple scenario. The figures are invented for illustration.
A town wants to know what share of adults support turning a parking lot into a skate park. Suppose the true situation is:
| Group | Share of town’s adults | Support for skate park |
|---|---|---|
| Adults under 40 | 50% | 70% |
| Adults 40 and over | 50% | 30% |
Step 1: The True Answer
The true level of support is a weighted average of the two groups:
\text{True support} = (0.50 \times 70\%) + (0.50 \times 30\%) = 35\% + 15\% = 50\%So the town is split evenly.
Step 2: The Biased Sample
The town council runs the survey through its Instagram page. Younger residents are much more likely to see it, so the replies come out 80% under 40 and only 20% aged 40 and over.
\text{Sample estimate} = (0.80 \times 70\%) + (0.20 \times 30\%) = 56\% + 6\% = 62\%The survey reports 62% support, a full 12 percentage points too high. Nobody lied, and the arithmetic is correct. The error comes entirely from who answered.
In general terms, the estimate is:
\hat{p} = w_1 p_1 + w_2 p_2where w₁ and w₂ are each group’s share of the sample, and p₁ and p₂ are each group’s level of support. When the sample shares (0.80 and 0.20) don’t match the population shares (0.50 and 0.50), and the groups disagree, the estimate is pulled toward the over-represented group.
Step 3: Would a Bigger Sample Help?
This is where biased samples become truly dangerous. Compare a properly random sample with the Instagram sample at three sizes:
| Sample size | Random sample: expected result | Instagram sample: expected result | Margin of error (95%) |
|---|---|---|---|
| 500 | 50% | 62% | ±4.4 points |
| 2,000 | 50% | 62% | ±2.2 points |
| 10,000 | 50% | 62% | ±1.0 point |
As the sample grows, the margin of error shrinks for both, but the Instagram survey keeps landing on 62%. With 10,000 replies it would report “62%, plus or minus 1 point,” which sounds extremely reliable and is completely wrong. More data only makes a biased answer look more precise.
Step 4: Can the Result Be Rescued?
If the council knows the true age mix of the town (from census figures, for example), it can reweight the replies so each age group counts in its correct proportion:
\text{Weighted estimate} = (0.50 \times 70\%) + (0.50 \times 30\%) = 50\%That fixes the age imbalance. But weighting only corrects for the factors you know about and adjust for. If Instagram users also differ from non-users in ways that matter (say, they skate more), weighting by age alone won’t remove that bias.
Real Examples of Biased Samples in the US
Online Opt-In Polls and the “Nuclear Submarine” Problem
Many online polls don’t select people at random. Instead, anyone who signs up for a survey panel, often for small rewards, can take part. Pew Research Center tested how well these opt-in samples hold up. In its March 2024 analysis, researchers Andrew Mercer, Courtney Kennedy and Scott Keeter reported that in a February 2022 opt-in survey:
- 12% of respondents under 30 claimed to be licensed to operate a nuclear submarine.
- About 24% of opt-in respondents who said they were Hispanic made the same claim, compared with 2% of non-Hispanic respondents.
The actual share of Americans with that license rounds to 0%. Pew traces the problem to “bogus respondents,” people who rush through surveys to collect rewards rather than answer sincerely. It suggests some may be getting past screening questions to qualify for a reward, though it notes the precise reasons are hard to pin down. Either way, the opt-in sample’s answers for these groups were badly distorted.
Bias gate: selection (who chooses to join) combined with response quality.
The 2020 Census Undercount
A census tries to count everyone, so it isn’t a sample. But it shows exactly how coverage bias works, and the way it’s measured is a great example of sampling done right.
After the 2020 Census, the US Census Bureau ran a Post-Enumeration Survey: it interviewed an independent sample of households and matched them against census records to see who had been missed or counted twice. According to the Bureau’s March 2022 release:
| Group | 2020 Census coverage |
|---|---|
| Hispanic or Latino population | Undercount of 4.99% |
| Black or African American population | Undercount of 3.30% |
| American Indian or Alaska Native people living on reservations | Undercount of 5.64% |
| Children aged 0–4 | Undercount of 2.79% |
| Non-Hispanic White alone population | Overcount of 1.64% |
| Asian population | Overcount of 2.62% |
Some groups were harder to reach and were missed more often; others were counted more than once. The lesson for any survey is clear: if even a full national count can miss certain groups at different rates, a sample drawn from an incomplete list can easily do the same.
Bias gate: the list (coverage).
Everyday Biased Samples You’ll Recognize
| Situation | Why the sample is biased |
|---|---|
| Product reviews on a shopping site | Mostly very happy or very angry buyers bother to write one |
| A TV call-in vote | Only viewers of that show who feel strongly enough take part |
| Asking classmates to estimate average study hours for a whole school | One class isn’t representative of all grades |
| A restaurant’s in-house satisfaction card | Unhappy customers who never came back aren’t there to fill one in |
| A weight-loss program’s success stories | People who quit or failed aren’t featured (survivorship) |
How to Tell If a Sample Is Biased or Unbiased
You usually can’t prove a sample is unbiased, but you can look for warning signs. Work through these questions whenever you read a survey result, a study or a news headline built on data.
1. Who Was the Result Supposed to Describe?
Find the target population. “Americans,” “customers” and “students” are too vague. If you can’t tell who the result is meant to apply to, you can’t judge whether the sample matches.
2. How Were People Chosen?
- Reassuring: “randomly selected,” “probability-based panel,” “address-based sample.”
- Warning sign: “readers who responded,” “visitors to our website,” “volunteers,” “people we spoke to on the street.”
If people chose themselves, assume the sample leans toward those with strong opinions or extra free time.
3. Could Anyone Be Missing From the Start?
Ask what list or channel was used. An online survey misses people without reliable internet; a weekday daytime phone survey misses many full-time workers; a survey only in English misses people who aren’t comfortable answering in English.
4. What Was the Response Rate, and Who Didn’t Respond?
A random invitation with a 5% response rate deserves caution, especially if the topic itself affects who answers (a survey on “Do you have too much free time?” mostly gets replies from people who do).
5. Does the Sample Match Known Facts?
Compare the sample’s age, gender, region or education with trusted figures, such as census data. Big gaps are a red flag.
| Characteristic | Sample | Known population | Verdict |
|---|---|---|---|
| Aged 18–29 | 41% | 20% | Young adults heavily over-represented |
| College graduates | 58% | 35% | Over-represented |
| Rural residents | 6% | 19% | Under-represented |
(Illustrative figures.) A sample like this is almost certainly biased, unless the researchers weighted it, and even then the weighting only fixes the traits they adjusted for.
6. Does the Result Pass the Common-Sense Test?
If 12% of young adults say they can drive a nuclear submarine, something is wrong with the sample, not with young adults.
Quick Checklist
| Question | Lower risk of bias | Higher risk of bias |
|---|---|---|
| How were people chosen? | By chance, from a full list | By convenience or self-selection |
| Who could be included? | Almost everyone in the population | Only those on one channel or list |
| Response rate | High, or non-response checked | Low and unexplained |
| Sample vs population profile | Close match | Large gaps |
| Method described openly? | Yes, in detail | Vague or missing |
How to Reduce Sampling Bias
Prevention is far easier than cure. Most of the work happens before a single answer is collected.
Before Collecting Data
- Start from the most complete list you can get. Check who is missing from it, and add a second source (for example, mobile numbers as well as landlines) if one group is left out.
- Let chance choose. Select people at random rather than picking who seems convenient or typical.
- Offer more than one way to respond. Phone, web and paper options reach different kinds of people.
- Follow up with non-responders. Reminders and second attempts bring in the busy and hard-to-reach, who often think differently.
- Screen out low-quality responses. Attention-check questions help catch people rushing through for a reward.
- Write neutral questions. “How satisfied are you?” is fairer than “How much did you love our new service?”
After Collecting Data
- Compare with benchmarks. Check the sample’s profile against census or other trusted data.
- Weight the results. If a group is under-represented, give each of its answers a bit more weight, as in the skate-park example above.
- Report limitations honestly. Say who was surveyed, how, the response rate, and which groups may be under-represented.
What Can and Can’t Be Fixed Later
| Problem | Can weighting fix it? |
|---|---|
| A known group is under-represented (e.g., older adults) | Mostly, if reliable population figures exist |
| Responders differ from non-responders in a known way | Partly |
| Some people had zero chance of selection | No; you have no data on them at all |
| Responders differ in ways nobody measured | No, and this is the hardest bias to detect |
| Insincere or bogus answers | No; they need to be screened out, not reweighted |
The safest rule: design the sample well from the start. Weighting is a repair tool, not a substitute for good sampling.
Frequently Asked Questions
What is an example of a biased sample?
A restaurant that measures customer satisfaction using cards left on its tables has a biased sample. Only people who are still eating there, and who choose to fill in a card, are included. Customers who had a bad meal and never returned have no voice, so satisfaction looks higher than it really is.
What does biased mean? Can you give an example?
“Biased” means unfairly leaning toward one side. A bathroom scale that always reads 2 pounds too heavy is biased: it’s wrong in the same direction every time. A biased sample is the same idea applied to people or data: it consistently over-represents some groups and under-represents others.
What does “sampling bias” mean?
Sampling bias is the systematic error that results from the way a sample is collected. It happens when certain members of the population are more or less likely to be included than others. The sample it produces is called a biased sample.
How can you tell if a sample is biased or unbiased?
Check how participants were chosen (by chance or by convenience), whether anyone was left out of the starting list, how many chosen people actually responded, and whether the sample’s makeup matches known population figures. A random selection from a complete list, a good response rate and a close match to the population are signs of an unbiased sample.
Is a biased sample the same as a small sample?
No. A small sample can be perfectly fair, just less precise. A huge sample can be badly biased. Size affects precision; the selection method affects bias.
Can a random sample still be biased?
The selection itself is fair, but bias can still creep in afterwards, mainly if many chosen people don’t respond and the non-responders differ from those who do. That’s why good surveys follow up with non-responders and check their final sample.
Conclusion
A biased sample is one that doesn’t give every part of the population a fair chance to be heard. It can enter through an incomplete list, convenience or self-selection, uneven response, or people who drop out of the data. Unlike ordinary sampling error, bias pushes results in one direction and doesn’t shrink as the sample grows, so a large biased survey can be confidently and precisely wrong.
The best defenses are simple to state, if not always easy to carry out: start from a complete list, let chance pick participants, chase non-responders, and compare the final sample with trusted population figures. When you read any statistic, asking “Who was actually asked, and who was left out?” is one of the most useful habits in statistics. It’s also the foundation for trusting any conclusion drawn through inferential statistics.
References
- Pew Research Center – Online opt-in polls can produce misleading results, especially for young people and Hispanic adults (March 5, 2024)
- US Census Bureau – Census Bureau Releases Estimates of Undercount and Overcount in the 2020 Census (March 10, 2022)
Disclaimer
This article is for general educational purposes only. The skate-park scenario, the comparison table and the everyday examples use illustrative figures. Statistics from Pew Research Center and the US Census Bureau are reported as published by those organizations on the dates cited. For research design or survey analysis, consult a qualified statistician or survey methodologist.