

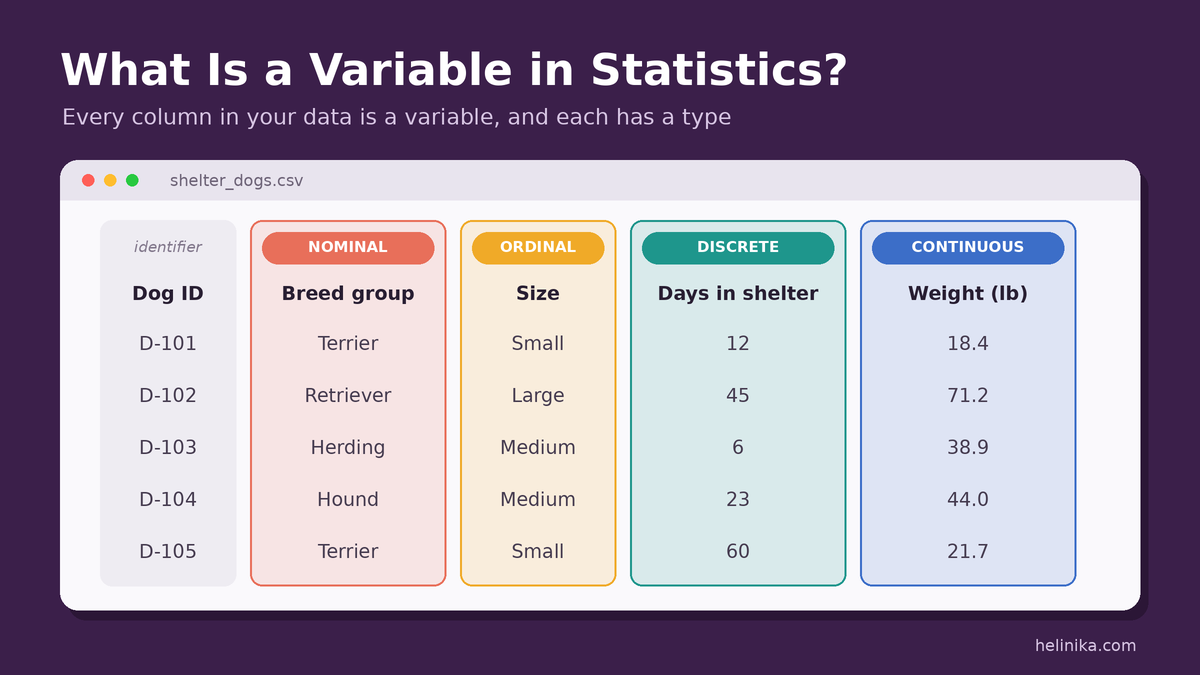
Export the records from an animal shelter, a fitness app or a school gradebook, and you’ll get a grid of rows and columns. Each column header (breed, weight, days in care, vaccinated?) names a variable in statistics: one specific thing that was recorded about every animal, person or event in the data. Get the variables right and the rest of the analysis has a solid foundation. Misread one, for example by averaging a column of ZIP codes, and the numbers you produce will be meaningless, however carefully you calculate them.
This article explains what a variable is, the main types of variables, and how to classify each column in a real dataset. It also shows which summaries and charts suit each type, and the traps that catch even experienced analysts.
Quick Info
| Topic | Detail |
|---|---|
| Definition | A characteristic that can take different values for different people, items or events |
| In a dataset | Usually one column |
| Two main families | Categorical (labels) and quantitative (numbers that measure or count) |
| Four common types | Nominal, ordinal, discrete, continuous |
| Roles in a study | Independent, dependent, confounding |
| Why it matters | The type decides which averages, charts and tests make sense |
| Reading time | About 10 minutes |
What Is a Variable in Statistics?
A variable is any characteristic that can take different values for different members of a group. Height, eye colour, monthly rent, number of pets and favourite streaming service are all variables, because they change from one person to the next.
The word “variable” simply means able to vary. If something is the same for everyone in your data, it isn’t really telling you anything about differences, and it’s called a constant instead.
The Vocabulary of a Dataset
Four terms come up constantly, and they’re easiest to understand using a small table. Here are records for five dogs at a fictional animal shelter in Denver:
| Dog ID | Breed group | Size | Age (years) | Weight (lb) | Days in shelter | Vaccinated? | Shelter city |
|---|---|---|---|---|---|---|---|
| D-101 | Terrier | Small | 3 | 18.4 | 12 | Yes | Denver |
| D-102 | Retriever | Large | 7 | 71.2 | 45 | Yes | Denver |
| D-103 | Herding | Medium | 1 | 38.9 | 6 | No | Denver |
| D-104 | Hound | Medium | 5 | 44.0 | 23 | Yes | Denver |
| D-105 | Terrier | Small | 10 | 21.7 | 60 | Yes | Denver |
| Term | Meaning | In the table |
|---|---|---|
| Variable | A characteristic recorded for every unit | Each column, such as “Weight (lb)” |
| Value | What one unit has for one variable | 71.2 lb for dog D-102 |
| Observation (case) | Everything recorded about one unit | One full row, such as all of dog D-103’s details |
| Constant | A characteristic that doesn’t vary in this data | “Shelter city” is Denver for every dog |
The dogs are the observational units, the things being studied. In a survey they’d be people; in a factory, light bulbs; in a weather study, days. Whether those units make up a full population or just a sample, the variables are what you actually record about them.
Notice that “Dog ID” is an odd one out. It’s different for every dog, but it doesn’t describe the dog; it only labels it. ID columns are identifiers, not variables you analyse. We’ll come back to this trap later.
Types of Variables in Statistics
Every variable falls into one of two families, and each family splits in two.
Categorical Variables (Qualitative)
A categorical variable places each unit into a group or label. Penn State’s introductory statistics course, STAT 200, describes these as names or labels, which may or may not have a logical order, without consistent differences between the groups.
- Nominal: categories with no natural order. Breed group (terrier, hound, retriever) and Vaccinated? (yes/no) are nominal. A yes/no variable with only two categories is also called binary.
- Ordinal: categories with a meaningful order, but uneven or unknown gaps between them. Size (small, medium, large) is ordinal: large is bigger than medium, but the “distance” from small to medium isn’t necessarily the same as from medium to large.
The CDC’s training course on epidemiology gives a neat warning about ordinal scales, using cancer stages: you cannot say the difference between Stages 1 and 3 is the same as the difference between Stages 2 and 4.
Quantitative Variables (Numerical)
A quantitative variable records a number that measures or counts something, where the size of the number really means something. Penn State describes these as numerical values with magnitudes that can be placed in a meaningful order with consistent intervals.
- Discrete: counts that jump in whole steps. Days in shelter (6, 12, 23…) is discrete; a dog can’t spend 12.7 days there in the records.
- Continuous: measurements that can, in principle, take any value in a range. Weight (18.4 lb, 21.7 lb…) is continuous; with a precise enough scale you could record 18.43 lb.
Age is a useful case. Measured exactly, age is continuous: time keeps flowing. Recorded in whole years, as in our table, it behaves like a discrete variable. Same idea, different recording choice.
Interval vs Ratio: A Finer Split
Some textbooks split quantitative variables further, by whether zero means “none of it.”
| Scale | Equal spacing? | True zero? | Example | Can you say “twice as much”? |
|---|---|---|---|---|
| Interval | Yes | No | Temperature in °F | No: 80°F isn’t twice as hot as 40°F |
| Ratio | Yes | Yes | Weight in pounds | Yes: a 40 lb dog weighs twice as much as a 20 lb dog |
The CDC course defines a ratio-scale variable as an interval variable with a true zero point. For most everyday analysis, both are simply treated as quantitative.
How to Classify Any Variable: Four Questions
Run each column through these questions in order:
- Is it just a label that identifies one unit (an ID, a name, an order number)? → It’s an identifier. Don’t analyse it.
- Does arithmetic on it make sense? Would an average mean anything? No → categorical. Yes → quantitative.
- If categorical: do the categories have a natural order? No → nominal. Yes → ordinal.
- If quantitative: is it counted in whole steps, or measured on a smooth scale? Counted → discrete. Measured → continuous.
Question 2 is the one that matters most. A ZIP code is made of digits, but the “average ZIP code” of your customers is nonsense, so ZIP code is categorical.
Worked Example: Classifying a Real Dataset
A small coffee chain exports a week of mobile-app orders to study customer habits. The file has eleven columns. Here’s how each one classifies, using the four questions above.
| Column | Example value | Classification | Why |
|---|---|---|---|
| Order number | 48213 | Identifier | Labels one order; tells you nothing about it |
| Store ZIP code | 80205 | Categorical, nominal | Digits, but averaging ZIP codes is meaningless |
| Day of week | Tuesday | Categorical (ordered, but cyclical) | Has an order, but Sunday loops back to Monday |
| Drink type | Latte | Categorical, nominal | Labels with no natural order |
| Drink size | Medium | Categorical, ordinal | Small < Medium < Large, but gaps aren’t equal amounts |
| Paid with app credit? | No | Categorical, nominal (binary) | Only two categories |
| Customer rating | 4 stars | Categorical, ordinal (often treated as numeric) | Ordered, but is 4→5 the same jump as 1→2? Not necessarily |
| Items in order | 3 | Quantitative, discrete | A count: 1, 2, 3… |
| Order total ($) | 11.85 | Quantitative, continuous | Money in cents is technically discrete, but it’s analysed as continuous |
| Wait time (minutes) | 6.5 | Quantitative, continuous | A measured amount of time |
| Outside temperature (°F) | 47 | Quantitative, continuous (interval) | Equal steps, but 0°F isn’t “no temperature” |
What the Classification Lets the Coffee Chain Do
Once each column is labelled, the analysis plan almost writes itself:
- “What’s our most popular drink?” Drink type is nominal, so count the orders in each category and report the most common one.
- “How long do customers wait?” Wait time is continuous, so a histogram shows the spread, and the median gives a typical wait that isn’t distorted by one 40-minute outlier.
- “Do larger sizes get better ratings?” Size and rating are both ordinal, so compare the share of 4- and 5-star ratings across small, medium and large.
- “Do people order more when it’s cold?” Temperature and items are both quantitative, so plot one against the other and look for a pattern.
And one thing not to do: average or chart the order numbers as if they measured something. They’re identifiers. If the chain wants trends over time, it should use the order date and time instead.
Why the Type of Variable Matters
The CDC course puts it simply: the type of values a variable has influences the way it can be summarized. In practice, the variable type decides which averages, spreads and charts give honest answers.
| Variable type | Sensible “typical value” | Sensible spread | Good charts | Avoid |
|---|---|---|---|---|
| Nominal | Mode (most common category) | Not applicable | Bar chart, frequency table | Mean, median |
| Ordinal | Median or mode | Range of categories, percentiles | Ordered bar chart | Treating gaps as equal without checking |
| Discrete | Mean or median | Range, standard deviation | Bar chart or dot plot (few values), histogram (many values) | Reporting fractions as if they were real counts without context |
| Continuous | Mean, or median if skewed | Standard deviation, range | Histogram, box plot | Pie charts of raw values |
A quick illustration with the coffee data: suppose five orders have drink sizes Small, Medium, Medium, Large, Large. The mode is a tie between Medium and Large, and the median is Medium. But coding the sizes as 1, 2, 3 and averaging them gives (1 + 2 + 2 + 3 + 3) ÷ 5 = 2.2, which invents a precision the data doesn’t have: “2.2” isn’t a drink size anyone can buy.
When Rules Bend: Rating Scales
Five-point ratings (1 to 5 stars, or “strongly disagree” to “strongly agree”) are ordinal, yet businesses and researchers often report an “average rating” of 4.3. That’s a widely used shortcut, and it can be reasonable when there are many responses and the points are designed to feel evenly spaced. Just be aware it’s a choice, not a fact about the data. Reporting the percentage of 4- and 5-star ratings alongside the average is often more honest.
The Roles Variables Play in a Study
Type describes what kind of values a variable holds. Role describes what job it does in a particular question. The same variable can play different roles in different studies.
| Role | Also called | What it does | Shelter example |
|---|---|---|---|
| Independent variable | Explanatory, predictor, x-variable | The factor you think may influence something | Whether a dog’s profile has a professional photo |
| Dependent variable | Response, outcome, y-variable | The result you measure | Days until adoption |
| Confounding variable | Lurking variable | A third factor linked to both, which can create a misleading connection | Age: younger dogs may get better photos and be adopted faster anyway |
Suppose the shelter finds that dogs with professional photos are adopted 10 days sooner on average. Before giving all the credit to the photos, it should check whether those dogs were also younger, smaller or listed during a busy season. Each of those could be a confounding variable.
The usual fixes are to compare like with like (for example, only dogs of similar age), to record possible confounders so they can be adjusted for, or, where practical, to assign the photo treatment at random. Randomly deciding which dogs get professional photos spreads age, size and season evenly across both groups.
Classification Traps to Watch For
Most mistakes with variables come from judging a column by how it looks rather than what it means.
Numbers That Are Really Labels
ZIP codes, phone numbers, jersey numbers, Social Security-style IDs and product codes are all written in digits, but none of them measure anything. Ask: “Would adding two of these together mean anything?” If not, the column is categorical or an identifier.
Categories Coded as Numbers
Survey software often stores answers as codes: 1 = Male, 2 = Female, 3 = Another identity; or 1 = Northeast, 2 = Midwest, 3 = South, 4 = West. Spreadsheet tools will happily calculate an “average region” of 2.6. The software doesn’t know the numbers are labels; you have to.
One Characteristic, Several Possible Types
The same idea can be recorded in different ways, and the recording decides the type.
| Characteristic | Recorded as | Type |
|---|---|---|
| Income | Exact dollars per year | Quantitative, continuous |
| Income | Bands: under $25k, $25k–$50k, $50k–$100k, $100k+ | Categorical, ordinal |
| Smoking | Cigarettes per day | Quantitative, discrete |
| Smoking | Never / former / current | Categorical, nominal |
| Age | Date of birth turned into exact age | Quantitative, continuous |
| Age | Age group: child / adult / senior | Categorical, ordinal |
Collecting the more detailed version is usually wiser: you can always group exact incomes into bands later, but you can’t recover exact incomes from bands.
Percentages and Rates
A column of percentages, such as the vaccination rate in each county, is quantitative and continuous, even though each value summarises many people.
“Variables” That Don’t Vary
If every row has the same value, as with the shelter city in our dog table, the column carries no information about differences within that dataset. It might matter later when you combine data from several shelters, but on its own it’s a constant.
Common Mistakes
- Averaging nominal codes such as ZIP codes, region numbers or jersey numbers.
- Treating ordinal scales as if the gaps were equal, without saying so.
- Calling counts “continuous” and reporting impossible fractions (“2.4 visits”) without explaining it’s an average.
- Analysing identifier columns as if they measured something.
- Forgetting that how you record a characteristic changes its type, and which methods you can use.
Frequently Asked Questions
What are the four types of variables in statistics?
The four most commonly taught types are nominal, ordinal, discrete and continuous. The first two are categorical; the last two are quantitative.
Is age a discrete or continuous variable?
Age itself is continuous, because time passes smoothly. When it’s recorded in whole years, it’s often handled like a discrete variable. When it’s grouped into bands (18–24, 25–34…), it becomes ordinal.
What is the difference between a variable and data?
A variable is the characteristic you record, such as weight. Data are the actual values you collect for it, such as 18.4 lb, 71.2 lb and 38.9 lb.
Can a yes/no question be a variable?
Yes. A yes/no answer is a categorical variable with two categories, called a binary variable. You summarise it with counts or percentages, such as “80% of the dogs are vaccinated.”
What is a random variable?
In probability, a random variable is a number whose value depends on chance, such as the total when two dice are rolled. Any variable measured on a randomly chosen unit can be treated as a random variable, which is what allows statistics to measure uncertainty.
Are variables and constants ever the same thing?
A characteristic can be a variable in one dataset and a constant in another. “Shelter city” is constant in a single Denver shelter’s records, but it becomes a variable once you combine data from shelters across the country.
Conclusion
A variable in statistics is any characteristic that can differ from one unit to the next, and in most datasets it’s simply a column. Sorting each one into its type, nominal, ordinal, discrete or continuous, is the first real step of any analysis, because it decides which averages, measures of spread and charts will give honest answers. Then ask what role it plays: something you change, something you measure, or something that might be muddying the picture.
The habit worth building is to look past the format of a column to its meaning. Digits don’t always make a number, and a neat average isn’t always a meaningful one. With that in place, everything else in statistics, from simple summaries to inferential statistics, rests on firmer ground.
References
- Penn State Eberly College of Science – STAT 200, 1.1.1: Categorical & Quantitative Variables
- Centers for Disease Control and Prevention – Principles of Epidemiology in Public Health Practice, Lesson 2, Section 2
Disclaimer
This article is for general educational purposes only. The animal shelter and coffee shop datasets are fictional examples created to illustrate the concepts. Terminology can vary slightly between textbooks and software, so follow your course or organization’s conventions where they differ.