

Your kid’s pediatrician says she’s in the 80th percentile for height. Your SAT report says 92nd percentile. A job site says your salary sits at the 40th percentile. Same word, three settings, and many people quietly read all three as “80%,” “92%” and “40%.” That’s not what they mean.
A percentile in statistics tells you the share of values in a group that fall at or below a given value. Being in the 80th percentile for height means the child is as tall as or taller than about 80% of children the same age and sex. It says nothing about getting 80% of anything right.
This guide explains what percentiles actually measure, how they differ from percentages, how to calculate both a percentile and a percentile rank by hand, and where real US paychecks fall on the percentile ladder in 2026.
Quick Info
| Topic | Detail |
|---|---|
| Short definition | The value at or below which a given percent of the data falls |
| Example | The 90th percentile is the value that 90% of the data is at or below |
| Percentile rank | The reverse question: what percentile is this particular value? |
| Not the same as | A percentage score (82% correct on a test is not the 82nd percentile) |
| Famous percentiles | 25th = Q1, 50th = the median, 75th = Q3 |
| Common surprise | Lower can be better (race times, wait times), which flips how you read the rank |
| Reading time | About 10 minutes |
What Is a Percentile?
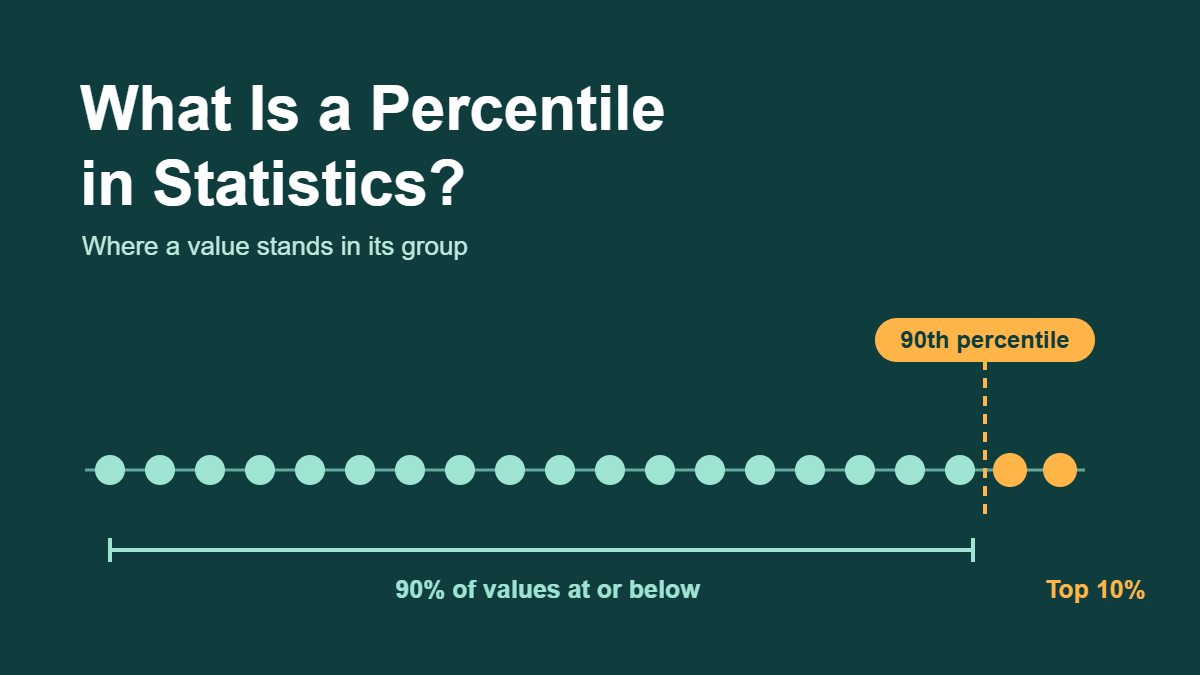
A percentile is the value below which a stated percentage of the data falls, so the 90th percentile is the point that 90% of values are at or under.
The CDC, which publishes the growth charts used in pediatricians’ offices, puts it this way: percentiles show a person’s position by indicating what percentage of the reference population the person equals or exceeds. Position is the key word. A percentile is about where you stand in a line, not about how much of something you got.
Think of 100 people lined up from lowest to highest on some measure. The person standing at spot 90 marks, roughly, the 90th percentile. Everyone behind them scored the same or lower.
Percentile vs Percentage vs Percentile Rank
These three get mixed up constantly, so here they are side by side.
| Term | What it answers | Example |
|---|---|---|
| Percentage | How much of a whole? | You got 41 of 50 questions right: 82% |
| Percentile | Which value marks a given position? | The 90th percentile score on the test was 46 |
| Percentile rank | What position does this value hold? | A score of 41 has a percentile rank of 70, so it beat about 70% of test-takers |
Notice that 82% correct and the 70th percentile describe the same student. If the test was easy, a high percentage can still land at an ordinary percentile. If it was brutal, 60% correct might be the 95th percentile.
How to Calculate a Percentile
There are two different questions you might be asking, and each has its own method.
Finding the Value at a Given Percentile
Use this when you want, say, “the 90th percentile.” Sort the data, then find the position:
R = (P / 100) x (n + 1)- P is the percentile you want (for example, 90).
- n is the number of values.
- R is a position in the sorted list, not the answer itself.
If R is a whole number, the value at that position is your percentile. If R lands between two positions, move the same fraction of the way between those two values. That last step is called interpolation, and it’s why percentiles are often numbers that don’t appear in your data.
Finding the Percentile Rank of a Value
Use this when you already have a value and want to know where it stands:
Percentile rank = (B + 0.5 x E) / n x 100- B is the number of values below yours.
- E is the number of values equal to yours (including yours).
- n is the total number of values.
The half-credit for ties keeps the rank fair when several people share the same score.
One honest warning: Excel, Google Sheets, graphing calculators and textbooks don’t all use the exact same rule, so small data sets can give slightly different answers. Our quartiles guide shows the same thing happening with Q1 and Q3. With large data sets the methods land almost on top of each other.
Worked Example: Ranking a 5K Finish
Twenty runners finished a neighborhood 5K. Their times, in minutes, sorted from fastest to slowest: (The figures are illustrative.)
18.9, 21.4, 22.0, 23.5, 24.1, 24.8, 25.6, 26.2, 26.9, 27.5,
28.3, 29.0, 29.8, 30.6, 31.4, 32.7, 34.1, 36.0, 38.5, 42.2
Jordan ran 25.6 minutes. Where does that rank?
Step 1: Decide Which Direction Is “Better”
In a race, a lower number is better. That matters, because a percentile on the raw times and a percentile among runners point in opposite directions.
Step 2: Count
Six runners were faster than Jordan, and 13 were slower. Nobody tied with 25.6, so E = 1 (Jordan).
Step 3: Rank the Time Itself
On the list of times, 6 values sit below 25.6:
Percentile rank of the time = (6 + 0.5 x 1) / 20 x 100 = 32.5Jordan’s time is at about the 33rd percentile of finishing times. That sounds bad until you remember that short times are good.
Step 4: Rank Jordan Among Runners
Now count the runners Jordan beat, the 13 slower ones:
Percentile rank as a runner = (13 + 0.5 x 1) / 20 x 100 = 67.5Jordan finished ahead of about two-thirds of the field. Same race, same time, two numbers that add up to 100. Whenever lower is better, flip the count.
Step 5: Find the 90th Percentile Time
The race director wants a cutoff that 90% of runners beat or matched:
R = (90 / 100) x (20 + 1) = 18.9Position 18.9 sits 90% of the way from the 18th time (36.0) to the 19th (38.5):
36.0 + 0.9 x (38.5 - 36.0) = 38.25 minutesSo 90% of runners finished in about 38 minutes or less. The 50th percentile, the median, comes out at 27.9 minutes the same way.
Real Example: The Percentile Ladder of US Paychecks
The Bureau of Labor Statistics reports weekly pay as a ladder of percentiles rather than one average. In its third-quarter 2026 earnings table, the 10th percentile of full-time wage and salary workers earned $634 a week, the median earned $1,232, and the 90th percentile earned $2,919.
Try the chart below: hover a bar to see its value, or type your own weekly pay to see roughly where it ranks.
Look at the steps between rungs. Going from the 10th percentile to the median adds $598 a week. Going from the median to the 90th percentile adds $1,687, almost three times as much. That lopsided climb is what a right-skewed distribution looks like, and it's exactly why pay is reported with percentiles instead of a single mean.
Reading Your Own Number Against the Ladder
Say you work full time and earn $1,500 a week. That's above the 50th percentile ($1,232) and below the 75th ($1,908), so you earn more than at least half of full-time workers but less than the top quarter. Five published percentiles can't pin you to an exact rank, but they place you in the right band, and the band is usually what you need.
Percentiles, Quartiles and Deciles: One Family
Quartiles and deciles aren't separate ideas. They're just percentiles with nicknames.
| Name | Percentile it equals | Where you'll see it |
|---|---|---|
| First decile | 10th | Low end of pay or income reports |
| First quartile (Q1) | 25th | Box plots, salary ranges |
| Median (Q2) | 50th | Home prices, "typical" anything |
| Third quartile (Q3) | 75th | Box plots, college admissions ranges |
| Ninth decile | 90th | High end of pay reports, cutoffs and benchmarks |
| 99th percentile | 99th | Gifted programs, extreme weather, server response times |
If you can find a percentile, you can find any of these. A frequency distribution table with a cumulative percent column is a quick way to read them off grouped data, and a histogram shows you why the gaps between them are uneven.
Where Percentiles Show Up in Everyday Life
- Growth charts: a toddler at the 15th percentile for weight is as heavy as or heavier than about 15% of children that age. Doctors usually watch whether a child stays near the same line over time more than the line itself.
- Standardized tests: score reports give a percentile rank so you can compare yourself with other test-takers, not with a perfect score.
- Pay and prices: salary surveys and home-price reports lean on the 25th, 50th and 75th percentiles because a few huge values would distort an average.
- Service speed: websites and call centers track the 90th or 95th percentile wait time, because "most people waited less than X" matters more than the average when the slowest waits drive complaints.
Common Percentile Mistakes
| Mistake | Reality |
|---|---|
| "90th percentile means 90% correct" | It means you scored as well as or better than about 90% of the group |
| "The 50th percentile is the average" | It's the median, which can differ a lot from the mean in skewed data |
| "Higher percentile is always better" | For times, costs and error rates, a lower percentile is the good one |
| "Equal steps in percentile mean equal steps in value" | The paycheck ladder shows the gaps can be wildly uneven |
| "You can be in the 100th percentile" | Most definitions stop at the 99th, since no one can be above everyone, themselves included |
| "A percentile from 20 people is as solid as one from 2 million" | Small groups make percentiles jumpy, especially near the 1st and 99th |
Frequently Asked Questions
What does it mean to be in the 90th percentile?
It means your value is as high as or higher than about 90% of the group you're compared with. Only about 10% scored above you. It doesn't mean you got 90% of the questions right, and the group matters: the 90th percentile among college applicants is a different bar than among all students.
Is the 50th percentile the same as the average?
The 50th percentile is the median, the middle value. It matches the mean only when the data is fairly symmetric. For weekly pay in late 2026, the median was $1,232, and because a long tail of high earners pulls averages up, an average would likely sit higher than that.
How is a percentile different from a percentage?
A percentage measures a part of a whole, like 41 out of 50 questions correct, or 82%. A percentile measures position in a group, like scoring higher than 70% of everyone who took the test. The same performance can be 82% correct and the 70th percentile at the same time.
Can you have a 0 or 100 percentile?
Most systems run from the 1st to the 99th percentile. A 0th percentile would mean nobody is at or below you, which can't be true since you're in the group, and a 100th would mean you beat yourself. Some software does print 0 or 100 for the minimum and maximum, so check the method if you see one.
Why do Excel and my calculator give different percentiles?
There are several accepted formulas, and each tool picks one. Excel's PERCENTILE.INC and PERCENTILE.EXC, for example, handle the ends of the data differently. On small data sets the answers can differ noticeably. On large ones they converge, so pick one method and say which you used.
What is the difference between a percentile and a quartile?
A quartile is a specific percentile. Q1 is the 25th percentile, Q2 (the median) is the 50th, and Q3 is the 75th. Percentiles simply give you 99 possible cut points instead of three.
Conclusion
A percentile tells you where a value stands in its group: the share of values at or below it. It isn't a score out of 100, it can point "backwards" when lower is better, and its rungs are often unevenly spaced, as US paychecks show. Calculate it by position, rank values with the B + 0.5E rule, and always ask which group the percentile is comparing you to.
The next time someone quotes a percentile, ask two quick questions: compared with whom, and is higher actually better here?
References
- U.S. Bureau of Labor Statistics, "Table 5. Quartiles and selected deciles of usual weekly earnings of full-time wage and salary workers by selected characteristics, third quarter 2026 averages," released October 21, 2026.
- Centers for Disease Control and Prevention, "What Are Clinical Growth Charts?," updated June 17, 2024.
Disclaimer
This article is for general educational purposes only. The race times and test scores are illustrative, and the earnings figures are BLS averages for the third quarter of 2026 that may be revised. Questions about a child's growth percentile should go to a pediatrician.