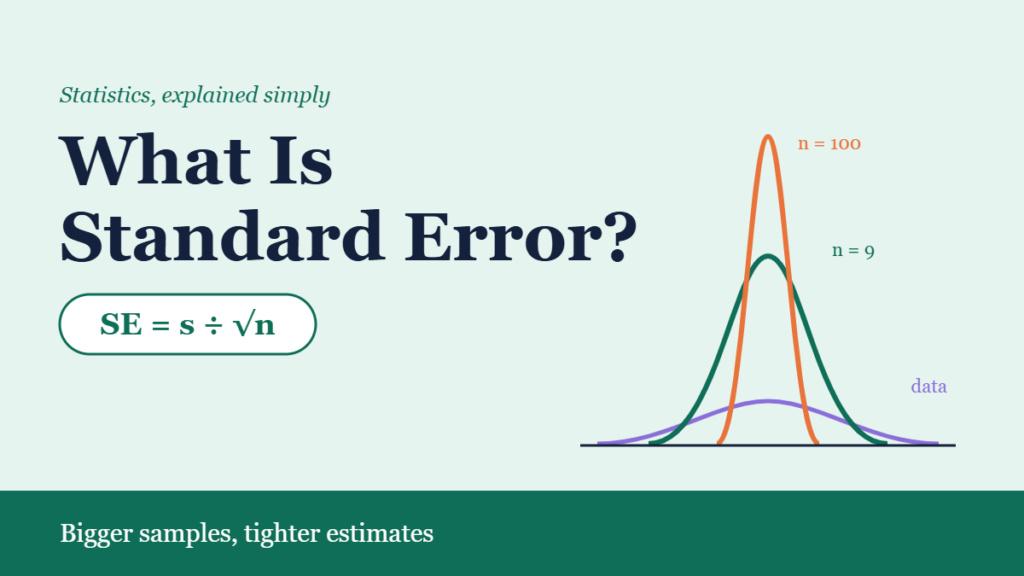
Ask 36 customers at a coffee shop how long they waited for their drink and you’ll get an average, say 4.2 minutes. Ask a different 36 customers tomorrow and you’ll get a slightly different average. Which one is the “real” wait time? Neither, exactly. Each is an estimate, and the standard error tells you how much an estimate like that tends to wobble from sample to sample.
That single number sits behind almost every confidence interval, margin of error and p-value you’ll ever read. If you’ve seen “±” next to a poll result or error bars on a research chart, you’ve met the standard error.
This guide explains what standard error means, how to calculate it step by step, how it differs from standard deviation, and why collecting more data shrinks it more slowly than most people expect.
Quick Info
| Topic | Detail |
|---|---|
| Short definition | How much a sample statistic (usually the mean) varies from sample to sample |
| Key formula | SE = s ÷ √n |
| What shrinks it | Larger samples (quadruple n to halve SE) |
| Not the same as | Standard deviation, which describes spread in the data itself |
| Main uses | Confidence intervals, margins of error, hypothesis tests |
| Common mistake | Reporting SE when readers need SD, or using “±” without saying which |
| Reading time | About 10 minutes |
What Is Standard Error?
The standard error is the standard deviation of a statistic across many possible samples. For the mean, it tells you how far your sample average is likely to be from the true population average.
Picture taking sample after sample from the same population, calculating the mean of each one, and plotting all those means. They’d pile up around the true average, with some spread. The standard error is the size of that spread.
You never actually take thousands of samples. The clever part is that you can estimate the standard error from just one sample, using its standard deviation and its size.
Standard error of the mean (SEM)
When people say “standard error” without any other word, they almost always mean the standard error of the mean, often shortened to SEM. GraphPad, maker of the widely used Prism statistics software, explains that the SEM “quantifies how precisely you know the true mean of the population,” and that a larger sample’s mean is likely to sit closer to that true mean.
GraphPad Prism Statistics Guide: The SD and SEM are not the same
Other standard errors
Every statistic you estimate from a sample has its own standard error: a proportion, a difference between two means, a regression slope, a correlation. The idea is identical in each case. Only the formula changes.
The Standard Error Formula
For the mean of a sample:
SE = s ÷ √n
- s is the sample standard deviation.
- n is the number of values in the sample.
- √n is the square root of the sample size.
If you happen to know the population standard deviation σ, you use σ ÷ √n instead. In real work, you rarely know σ, so s stands in for it.
Why divide by the square root of n?
Averaging cancels out some of the randomness. A single customer’s wait might be unusually long, but in a group of 36, long and short waits balance each other. The more values you average, the more cancelling happens.
The math says the variance of a mean equals the data’s variance divided by n. Taking the square root of both sides gives s ÷ √n. That square root is why the gains from extra data slow down.
Standard error of a proportion
For a yes/no question, such as the share of voters who support a measure:
SE = √[ p × (1 − p) ÷ n ]
Here p is the sample proportion as a decimal. If 60% of 400 people say yes, the standard error is √(0.6 × 0.4 ÷ 400) ≈ 0.0245, or about 2.4 percentage points.
Worked Example: Coffee Shop Wait Times
A café owner times the drink wait for 36 randomly chosen orders. The sample mean is 4.2 minutes and the sample standard deviation is 1.8 minutes.
Step 1: Write down what you know
- Sample mean x̄ = 4.2 minutes
- Sample standard deviation s = 1.8 minutes
- Sample size n = 36
Step 2: Take the square root of n
√36 = 6
Step 3: Divide the standard deviation by √n
SE = 1.8 ÷ 6 = 0.3 minutes
Step 4: Interpret it
Individual waits vary by about 1.8 minutes (that’s the standard deviation). The average wait from a sample of 36, though, would typically land within about 0.3 minutes of the true average. The owner’s estimate of 4.2 minutes is much more precise than any single customer’s experience.
Step 5: Build a rough 95% confidence interval
Multiply the standard error by about 2 (1.96 for large samples) and add it to both sides of the mean:
4.2 ± 1.96 × 0.3 = 4.2 ± 0.59
→ about 3.6 to 4.8 minutes
With only 36 values, a t-multiplier of about 2.03 is slightly more accurate, giving roughly 3.6 to 4.8 minutes as well. A range like this is a confidence interval, the kind of statement inferential statistics is built on.
How Sample Size Changes the Standard Error
Here’s the café example again with the same standard deviation (1.8 minutes) and different sample sizes:
| Sample size (n) | √n | Standard error |
|---|---|---|
| 9 | 3 | 0.60 min |
| 36 | 6 | 0.30 min |
| 144 | 12 | 0.15 min |
| 576 | 24 | 0.075 min |
Notice the pattern. Each time the sample grows four times larger, the standard error is cut in half. Going from 36 to 144 orders halves the uncertainty. Halving it again takes 576 orders.
This is the “square root law,” and it’s the reason big surveys get expensive fast. Precision improves, but each extra decimal place costs far more data than the last.
Try it: watch the sampling distribution shrink
The wide purple curve shows how individual wait times spread out. The tall green curve shows how sample means spread out for the sample size you choose. Press the button to simulate 40 real samples and see where their means land.
Purple: how individual wait times spread (mean 4.2, SD 1.8 minutes). Green: how sample means spread for your chosen n. Dots: means from simulated samples. Quadruple n and the green curve gets half as wide.
Standard Error vs Standard Deviation
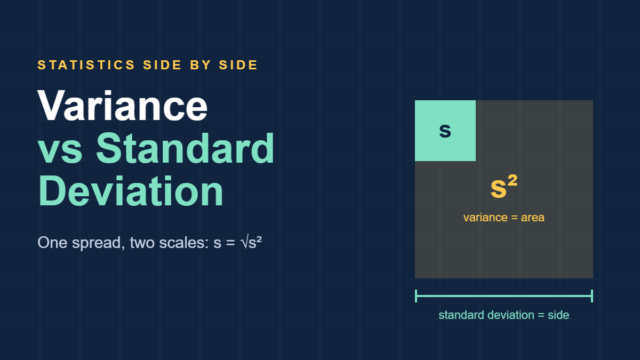
These two get confused constantly, even in published research. Douglas Altman and Martin Bland, writing in the BMJ, described the difference as the distinction between data description and inference: the standard deviation describes how scattered the measurements are, while the standard error describes the precision of the sample mean.
Altman and Bland, "Standard deviations and standard errors," BMJ (2005)
| Feature | Standard deviation | Standard error |
|---|---|---|
| Describes | Spread of individual values | Spread of a sample statistic |
| Question it answers | "How different are the customers?" | "How sure am I about the average?" |
| As n grows | Stays roughly the same | Shrinks toward zero |
| Formula link | s | s ÷ √n |
| Report it when | Describing your data | Showing uncertainty in an estimate |
A simple test: if you doubled your sample, would you expect the number to fall? If yes, it's a standard error. If no, it's a standard deviation.
The "±" problem
A paper that writes "mean 4.2 ± 0.3" could mean the standard deviation is 0.3 or the standard error is 0.3. Those describe wildly different situations. Altman and Bland note that the BMJ asks authors to say clearly which one they're reporting. When you write your own results, always name it.
Where You'll See Standard Error in Real Life
Poll margins of error
When a news poll of 1,000 adults reports a "margin of error of ±3 points," that figure comes from the standard error of a proportion. For a 50% result, √(0.5 × 0.5 ÷ 1,000) ≈ 0.0158, and 1.96 × 1.58 ≈ 3.1 points.
Error bars in charts
Scientific charts often show bars above and below each mean. Sometimes they're standard deviations, sometimes standard errors, sometimes 95% confidence intervals. Check the caption before you judge whether two groups overlap.
Hypothesis tests
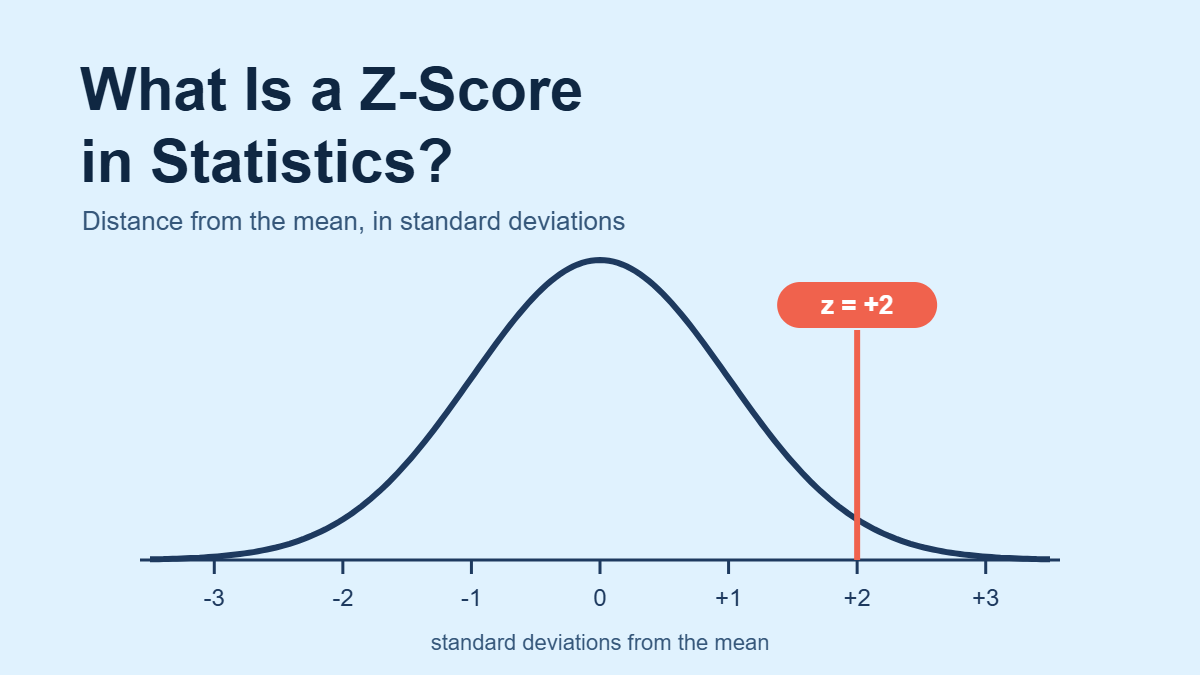
A t-test divides the difference between two means by its standard error. The result is a signal-to-noise ratio that works much like a z-score: the bigger it is, the less likely the difference is just sampling luck.
Quality control
Factories that sample a few items from each batch use the standard error to decide whether a batch's average weight or size has drifted from the target, or whether the difference is just normal sample-to-sample noise.
What Standard Error Can't Fix
A small standard error means your estimate is precise. It doesn't mean it's right.
If the café owner only timed orders during the quiet morning hours, the sample would be a biased sample. The standard error would still shrink as more morning orders came in, but the estimate would stay stuck on the wrong value. Standard error measures random wobble only, not systematic error. That's why good random sampling matters before any formula does.
Common Mistakes and Myths
| Myth | Reality |
|---|---|
| "Standard error and standard deviation are interchangeable." | SD describes the data; SE describes the precision of an estimate. |
| "A tiny standard error proves the result is accurate." | It shows precision, not freedom from bias. |
| "Doubling the sample halves the standard error." | You need four times the sample to halve it. |
| "Report SE to make the data look less variable." | That misleads readers. Use SD to describe spread. |
| "The ± sign tells you which one is used." | It doesn't. Always label SD or SE. |
| "Standard error only applies to means." | Proportions, slopes and differences all have their own SE. |
Frequently Asked Questions
What does standard error tell you in simple terms?
It tells you how much your sample result would likely change if you repeated the study with a fresh sample of the same size. A small standard error means repeated samples would give similar answers, so your estimate is precise. A large one means another sample could give a noticeably different result.
What is a good standard error?
There's no universal cutoff. Judge it relative to the mean and to the decision you need to make. A standard error of 0.3 minutes is tiny for a 4-minute average wait, but a standard error of 0.3 points on a 1.0 grade difference would leave you quite unsure. Smaller is always more precise.
How do you calculate standard error in Excel?
Excel has no single SE function, but you can combine two. For data in A1:A36, use =STDEV.S(A1:A36)/SQRT(COUNT(A1:A36)). STDEV.S gives the sample standard deviation and COUNT gives n. Google Sheets accepts the same formula.
Is standard error the same as margin of error?
Not quite. The margin of error is the standard error multiplied by a critical value, usually about 1.96 for 95% confidence. So a poll with a standard error of 1.5 points has a margin of error of roughly 3 points. The standard error is the building block.
Can standard error be larger than standard deviation?
For the mean, no, as long as you have at least one value. Since SE = s ÷ √n and √n is 1 or more, the standard error is always equal to or smaller than the standard deviation. They're equal only when n is 1, which tells you nothing about precision anyway.
Why does standard error decrease with sample size?
Larger samples average out more random ups and downs, so their means cluster more tightly around the true value. Because the formula divides by √n, the shrinking follows a square root pattern: four times the data halves the standard error, and a hundred times the data cuts it to one tenth.
Conclusion
The standard error measures how much a sample estimate would bounce around if you repeated the study. For a mean, it's the standard deviation divided by the square root of the sample size. It powers confidence intervals, margins of error and significance tests, and it's different from the standard deviation, which describes the data itself.
Carry this rule with you: standard deviation describes the people, standard error describes the average. And remember the price of precision: to cut the standard error in half, you need four times the data.
Disclaimer
This article is for general educational purposes only. The café and survey figures in the examples are illustrative. For study design or published research, consult a qualified statistician.