

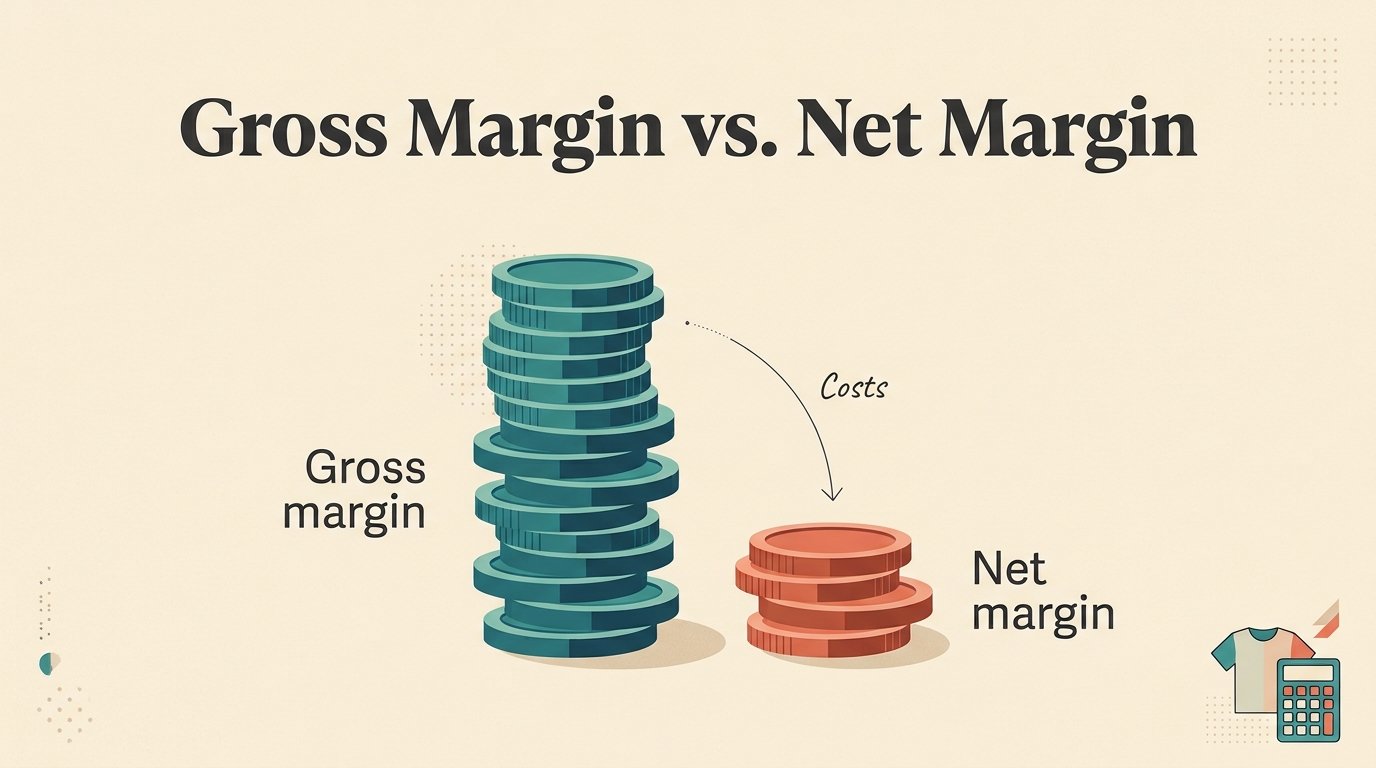
A small shop brings in $40,000 in a month. Is that a good month? It depends on which margin you check. This guide to gross margin vs net margin builds on our pillar article on the difference between revenue and profit, and turns those dollar amounts into percentages you can compare.
Gross margin counts only the direct cost of making what you sold. Net margin counts every cost the business pays. A company can look healthy on one number and be losing money on the other.
Below, you’ll learn both formulas, follow a worked example from revenue to net margin, and see how real companies like Apple and Costco compare.
Quick Info
| Topic | Detail |
|---|---|
| Short answer | Gross margin is the share of revenue left after direct costs. Net margin is the share left after all costs. |
| Gross margin formula | (Revenue minus COGS) ÷ Revenue × 100 |
| Net margin formula | Net profit ÷ Revenue × 100 |
| Common mistake | Mixing up margin with markup |
| Key warning | A good margin depends heavily on the industry |
| Reading time | About 10 minutes |
What Is Profit Margin?
Profit margin is profit expressed as a percentage of revenue, showing how many cents of every sales dollar the business keeps.
Profit margin = (Profit ÷ Revenue) × 100Profit is the dollar amount left over, and revenue is the total sales. Dividing one by the other gives a ratio, which is a quotient in math. Multiplying by 100 turns it into a percentage. If that last step feels rusty, our guide on how to calculate percentage covers it.
Why use a percentage instead of dollars? Because it lets you compare a corner shop with a giant retailer, or this month with last month, on equal terms.
There are three common margins, one for each landing on the profit staircase: gross, operating and net. This article focuses on the two ends of that staircase.
What Is Gross Margin?
Gross margin is the percentage of revenue left after subtracting the cost of goods sold (COGS).
Gross margin = ((Revenue minus COGS) ÷ Revenue) × 100Revenue is total sales. COGS is the direct cost of producing or buying what you sold, such as materials, printing and packaging. The part of revenue left after COGS is called gross profit.
Gross margin answers one question: does each sale earn enough above its direct cost? If it does not, no amount of cost-cutting elsewhere will fix the business.
What Is Net Margin?
Net margin is the percentage of revenue left after subtracting every cost: direct costs, running costs, interest and taxes.
Net margin = (Net profit ÷ Revenue) × 100Net profit is the true bottom line. The SEC explains that it is the result after all expenses, including interest and income tax, are deducted, and that it is also called net income or net earnings.
SEC, Beginners’ Guide to Financial Statements
Between the two sits operating margin, which subtracts running costs such as rent, wages and advertising but not yet interest or taxes.
Gross Margin vs Net Margin at a Glance
| Feature | Gross margin | Net margin |
|---|---|---|
| Costs subtracted | COGS only | COGS, operating costs, interest and taxes |
| Formula | (Revenue minus COGS) ÷ Revenue × 100 | Net profit ÷ Revenue × 100 |
| Question it answers | Is each sale worth its direct cost? | Is the whole business profitable? |
| Which is higher? | Almost always higher | Almost always lower |
| Best used for | Pricing and product decisions | Overall health and owner earnings |
Worked Example: From Revenue to Net Margin
Let’s follow one business through every step. Harbor Tees is an imaginary online t-shirt shop. All figures here are illustrative, and the tax rate is a simple 25% chosen to keep the math clean.
In one month, Harbor Tees sells 1,600 shirts at $25 each. Each shirt costs $11 to blank, print and pack.
Step 1: Find revenue
Revenue = 1,600 shirts × $25 = $40,000Step 2: Calculate gross profit and gross margin
COGS is the direct cost of the shirts sold.
COGS = 1,600 × $11 = $17,600
Gross profit = $40,000 minus $17,600 = $22,400
Gross margin = $22,400 ÷ $40,000 × 100 = 56%
For every sales dollar, 56 cents is left after paying for the shirts themselves.
Step 3: Subtract operating expenses
Now add the costs of running the shop, which are not tied to any single shirt.
| Operating expense | Monthly cost |
|---|---|
| Online ads | $6,000 |
| Contractor wages | $5,500 |
| Software | $600 |
| Studio rent | $1,500 |
| Insurance | $300 |
| Total | $13,900 |
Operating profit = $22,400 minus $13,900 = $8,500
Operating margin = $8,500 ÷ $40,000 × 100 = 21.25%
Step 4: Subtract interest and taxes
Harbor Tees pays $500 in loan interest. That leaves $8,000 before tax. At a 25% tax rate, the tax bill is $2,000.
Profit before tax = $8,500 minus $500 = $8,000
Tax = $8,000 × 0.25 = $2,000
Net profit = $8,000 minus $2,000 = $6,000
Step 5: Calculate net margin
Net margin = $6,000 ÷ $40,000 × 100 = 15%Here is the full staircase in one view.
| Level | Dollars | Margin |
|---|---|---|
| Revenue | $40,000 | 100% |
| Gross profit | $22,400 | 56% |
| Operating profit | $8,500 | 21.25% |
| Net profit | $6,000 | 15% |
The gap between 56% and 15% is the cost of running the business. Neither number is wrong. They answer different questions.
When a Healthy Gross Margin Hides a Loss
Gross margin can look great while the business bleeds money. Suppose Harbor Tees pushes hard on advertising next month and spends $15,000 instead of $6,000. Sales and shirt costs stay the same.
| Line | Normal month | Heavy ad month |
|---|---|---|
| Revenue | $40,000 | $40,000 |
| Gross profit | $22,400 | $22,400 |
| Gross margin | 56% | 56% |
| Operating expenses | $13,900 | $22,900 |
| Operating profit | $8,500 | minus $500 |
| Net profit (after $500 interest) | $6,000 | minus $1,000 |
| Net margin | 15% | minus 2.5% |
The gross margin never moved. An owner who watched only that number would see 56% and feel fine, while the shop lost $1,000. This is why you need both margins side by side.
A simple rule helps: gross margin tells you whether your product pricing works, and net margin tells you whether your whole business works.
Margin vs Markup: Don’t Mix Them Up
Margin and markup both describe the gap between cost and price, but they divide by different numbers.
| Measure | Formula | Divides by |
|---|---|---|
| Margin | (Price minus Cost) ÷ Price × 100 | Selling price |
| Markup | (Price minus Cost) ÷ Cost × 100 | Cost |
Take a Harbor Tees shirt that costs $11 and sells for $25. The $14 difference gives two very different percentages.
Margin = $14 ÷ $25 × 100 = 56%
Markup = $14 ÷ $11 × 100 = 127.3%
Same shirt, same profit, two numbers. If you set prices by adding a 56% markup but your goal was a 56% margin, you would underprice every sale.
How to price for a target margin
Say Harbor Tees wants a 60% gross margin on a shirt that costs $11. Let P be the price. Profit is P minus 11, and it must equal 60% of P.
P minus 11 = 0.6P
0.4P = 11
P = 11 ÷ 0.4 = $27.50
Check it: ($27.50 minus $11) ÷ $27.50 = 0.60. If setting up an equation like this feels unfamiliar, our guide to solving linear equations walks through the same moves.
Real Examples: Apple vs Costco
The same formulas work on the biggest companies in the world, and the results show how much industry matters. The figures below come from each company’s fiscal 2025 results.
Apple’s fiscal year ended September 27, 2025. Its net sales were $416.2 billion, and its net income was $112.0 billion, according to the company’s earnings release.
Apple, “Apple reports fourth quarter results”
Costco’s fiscal year ended August 31, 2025. Its total revenue was about $275.2 billion, with net income of about $8.1 billion, as shown in its filing with the U.S. Securities and Exchange Commission.
Costco, Form 8-K exhibit, fiscal 2025 results
| Margin | Apple | Costco |
|---|---|---|
| Gross margin | 46.9% | 12.8% (our calculation) |
| Operating margin | 32.0% | 3.8% |
| Net margin | 26.9% | 2.9% |
For Costco, we calculated gross margin as total revenue minus merchandise costs, divided by total revenue. Costco does not report a line called gross profit in the same way, so treat that figure as our estimate.
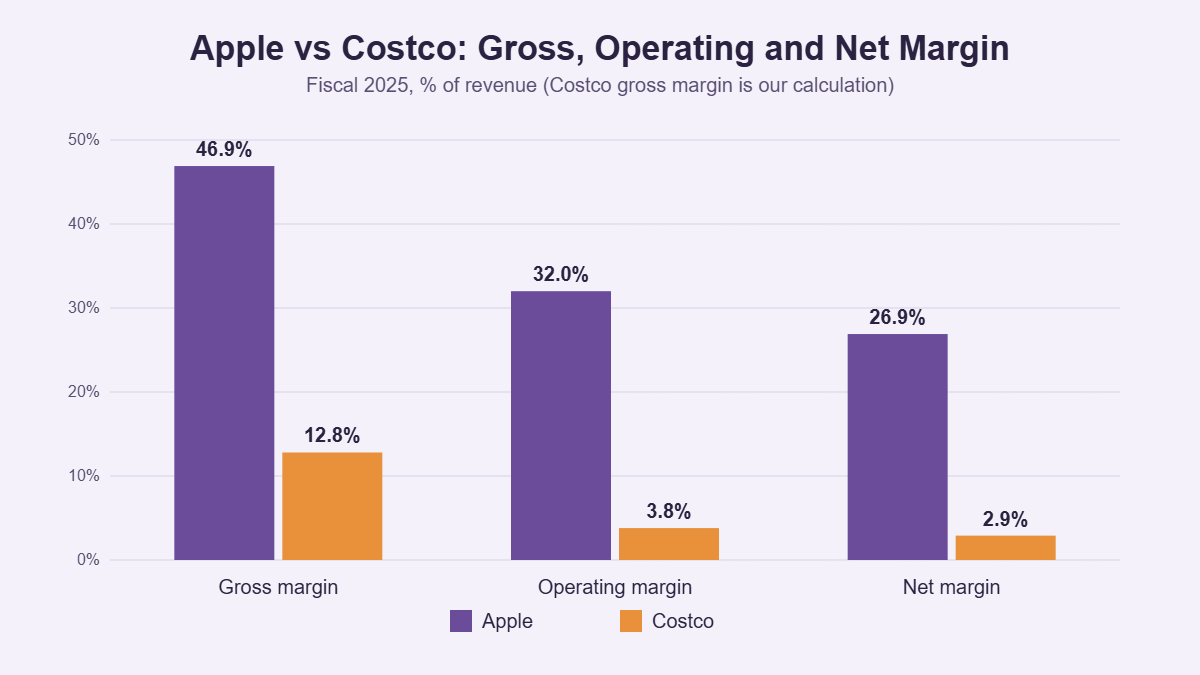
Costco earns far less on every dollar of sales, yet it is a hugely successful business. It sells at low prices and makes up the difference in volume. Apple sells fewer, pricier products and keeps much more of each dollar. Neither strategy is wrong. A “good” margin only makes sense compared with similar companies.
How to Improve Your Margins
Margins rise when you earn more per sale or spend less to make it. Here is where each lever acts.
| Action | Helps which margin | Example |
|---|---|---|
| Raise prices carefully | Gross and net | Move a $25 shirt to $27.50 |
| Negotiate supplier costs | Gross and net | Cut shirt cost from $11 to $10 |
| Drop low-margin products | Gross and net | Stop selling items that barely cover COGS |
| Trim ad spend that doesn’t convert | Net | Cut ads that bring few buyers |
| Review rent, software and subscriptions | Net | Cancel tools nobody uses |
| Refinance costly debt | Net | Lower the monthly interest bill |
Change one lever at a time when you can. That way you will see which move actually helped.
Common Myths About Profit Margins
| Myth | Reality |
|---|---|
| A high gross margin means a profitable business | Operating costs can erase it, as the heavy ad month showed |
| Margin and markup are the same thing | They use different denominators and give different percentages |
| A higher margin always beats a lower one | Low-margin, high-volume businesses like Costco can be very successful |
| Net margin tells you cash in the bank | Net profit is an accounting result, and cash timing can differ |
| One good month proves the model works | Margins swing with seasons, so track a longer stretch |
Frequently Asked Questions
What is the difference between gross margin and net margin?
Gross margin only subtracts the direct cost of making or buying what you sold. Net margin subtracts every cost, including operating expenses, interest and taxes. Because it removes fewer costs, gross margin is almost always the higher number. Gross margin tests your pricing, while net margin tests the whole business.
How do you calculate gross profit margin?
Subtract cost of goods sold from revenue to get gross profit, then divide gross profit by revenue and multiply by 100. For example, $40,000 in sales with $17,600 in COGS leaves $22,400 in gross profit. Divide $22,400 by $40,000 and you get a 56% gross margin.
How do you calculate net profit margin?
Start with net profit, which is revenue minus all expenses, interest and taxes. Divide it by revenue and multiply by 100. If a business earns $6,000 in net profit on $40,000 in revenue, its net margin is 15%. A negative result means the business lost money for that period.
What is a good profit margin?
It depends on the industry. Apple’s net margin was 26.9% in fiscal 2025, while Costco’s was about 2.9%, and both are healthy for their models. Compare your numbers with similar businesses and with your own past results instead of chasing one universal target.
Can gross margin be high while net margin is negative?
Yes. If operating costs such as advertising, wages and rent are larger than gross profit, the business loses money even with a strong gross margin. In the Harbor Tees example, a 56% gross margin turned into a net margin of minus 2.5% when ad spend rose to $15,000.
Is margin the same as markup?
No. Margin divides profit by the selling price, while markup divides profit by the cost. A shirt that costs $11 and sells for $25 has a 56% margin but a 127.3% markup. Mixing them up leads to underpricing.
Conclusion
Gross margin shows whether each sale earns enough above its direct cost. Net margin shows what the business keeps after paying for everything. Track both, because one can look strong while the other signals trouble. To judge your results, compare them with a typical figure for your industry, much like checking a median before deciding what counts as normal.
Here is a rule worth carrying with you: gross margin tells you if your product pays its way, and net margin tells you if your business does. Which one are you watching more closely?
References
- Apple, “Apple reports fourth quarter results”, Business Wire, October 30, 2025.
- Costco Wholesale Corporation, Form 8-K exhibit, fiscal 2025 fourth quarter and year-end results, U.S. Securities and Exchange Commission.
- U.S. Securities and Exchange Commission, “Beginners’ Guide to Financial Statements”, January 12, 2014.
Disclaimer
This article is for general educational purposes only and is not financial, tax or accounting advice. The Harbor Tees scenario and its figures are illustrative. Company figures are taken from public filings and may be restated. For decisions about your own business, consult a qualified accountant.