

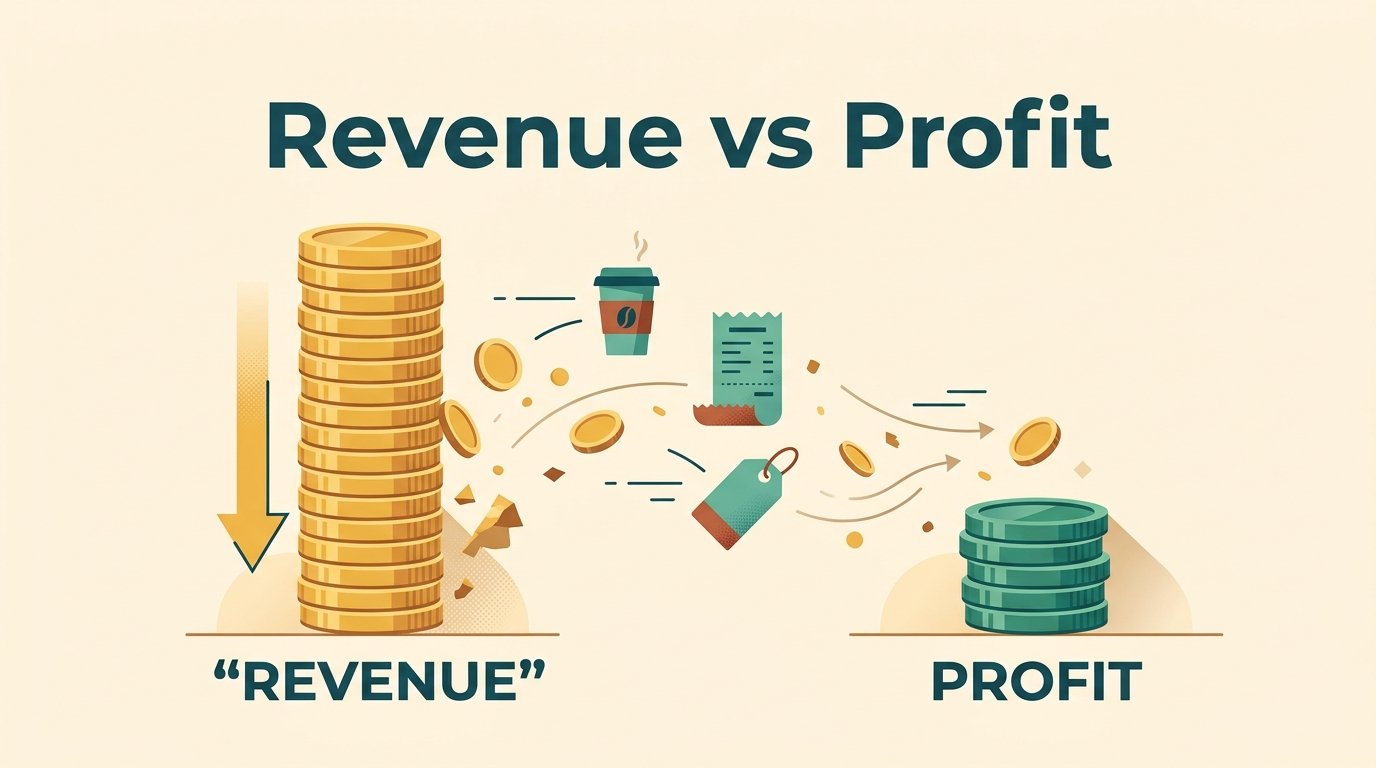
A shop rings up $100,000 in sales this month. Did the owner just make $100,000? Not even close.
Revenue is the money that comes in. Profit is what is left after the business pays its bills. The difference between revenue and profit confuses students, new business owners and plenty of people reading earnings news, because both numbers sit on the same report and both are measured in dollars.
Here is the short version: revenue tells you how much a business sold, and profit tells you whether selling it was worth the cost. Below, you’ll see how revenue turns into profit one step at a time, then test the idea on a coffee cart and on a real Costco financial report.
Quick Info
| Topic | Detail |
|---|---|
| Short answer | Revenue is total money earned from sales. Profit is revenue minus costs. |
| Key formula | Profit = Revenue minus Total costs |
| Main profit types | Gross profit, operating profit and net profit |
| Common mistake | Treating the sales total as money the owner keeps |
| Key warning | Revenue can rise while profit falls |
| Reading time | About 10 minutes |
What Is Revenue?
Revenue is the total amount of money a business earns from selling its goods or services, before any costs are subtracted.
People also call it sales or the top line, because it is the first number at the top of an income statement. A bakery that sells 300 muffins at $4 each has $1,200 in revenue for that batch, no matter what the flour, rent or wages cost.
The U.S. Securities and Exchange Commission explains that an income statement reports revenue over a set period, and that returns and discounts are subtracted from gross sales to reach net revenues.
SEC, Beginners’ Guide to Financial Statements
The basic formula is simple:
Revenue = Price per unit × Number of units soldPrice per unit is what one customer pays for one item. Number of units sold is how many items you actually sold. If you want to see how products and sums like this fit together, our guide to what an equation is in math covers the basics.
Revenue usually comes from the business’s main activity, such as selling coffee. Occasional extras, like interest earned at a bank or cash from selling an old oven, are sometimes tracked separately as non-operating income.
What Is Profit?
Profit is the money a business has left after it subtracts its costs from its revenue.
Profit = Revenue minus Total costsTotal costs include everything it took to earn that revenue: ingredients, wages, rent, utilities, insurance, interest on loans and taxes. If costs are bigger than revenue, the result is negative, and that negative number is called a loss.
The SEC guide notes that net profit, the final figure after all expenses, is also called net income or net earnings. So when a news story says a company’s “earnings” rose, it usually means profit, not sales.
SEC, Beginners’ Guide to Financial Statements
Revenue vs Profit at a Glance
| Feature | Revenue | Profit |
|---|---|---|
| Question it answers | How much did we sell? | How much did we keep? |
| Position on income statement | Top line | Bottom line (net profit) |
| Can it be negative? | No | Yes (a loss) |
| Formula | Price × Units sold | Revenue minus Total costs |
| Best used for | Judging demand and growth | Judging health and efficiency |
The Profit Staircase: From Revenue Down to Net Profit
There is not just one kind of profit. Picture a staircase. You start at the top with revenue and step down, subtracting one group of costs at each landing. The number at each landing has its own name.
Gross Profit
Gross profit is revenue minus the direct cost of making or buying what you sold. For a coffee cart, that means beans, milk, cups and lids. Accountants call this the cost of goods sold, or COGS.
Operating Profit
Operating profit is gross profit minus the running costs of the business, such as rent, wages, marketing, insurance and equipment wear. It shows how well the business earns from its normal work.
Net Profit
Net profit is what remains after interest on loans and income taxes come off. It is the true bottom line.
| Step | Formula | What it tells you |
|---|---|---|
| Gross profit | Revenue minus COGS | Whether your product earns more than it costs to make |
| Operating profit | Gross profit minus operating expenses | Whether the business works day to day |
| Net profit | Operating profit minus interest and taxes | What the owners actually keep |
Worked Example: One Month at a Coffee Cart
Let’s follow a made-up cart, Maple Lane Coffee, through one month. All figures here are illustrative, so you can check the arithmetic yourself.
Step 1: Find the Revenue
The cart sells 4,000 drinks at an average price of $5.
Revenue = 4,000 × $5 = $20,000Step 2: Subtract the Cost of Goods Sold
Beans, milk, cups and lids cost $1.55 per drink.
COGS = 4,000 × $1.55 = $6,200
Gross profit = $20,000 minus $6,200 = $13,800
Step 3: Subtract Operating Expenses
| Expense | Monthly cost |
|---|---|
| Space rental and permit | $2,400 |
| Wages | $5,600 |
| Marketing | $600 |
| Insurance | $400 |
| Equipment wear | $500 |
| Total operating expenses | $9,500 |
Operating profit = $13,800 minus $9,500 = $4,300Step 4: Subtract Interest and Taxes
The cart pays $300 in loan interest. We’ll assume a 20% income tax rate to keep the math simple.
Profit before tax = $4,300 minus $300 = $4,000
Tax = 20% of $4,000 = $800
Net profit = $4,000 minus $800 = $3,200
Step 5: Turn the Results Into Margins
A margin shows profit as a share of revenue. If percentages feel rusty, our guide on how to calculate percentage walks through it.
Net profit margin = ($3,200 ÷ $20,000) × 100 = 16%Work the brackets first, then multiply. If you want a refresher on why, see this explanation of the order of operations.
| Measure | Amount | Share of revenue |
|---|---|---|
| Revenue | $20,000 | 100% |
| Gross profit | $13,800 | 69% |
| Operating profit | $4,300 | 21.5% |
| Net profit | $3,200 | 16% |
The cart brought in $20,000, but the owner keeps $3,200. Every step down the staircase shaves something off.
Real Example: Costco’s Revenue vs Profit
A made-up cart is handy for practice, but real numbers show the gap at a much larger scale. Costco’s fiscal 2025 (52 weeks ended August 31, 2025) results are a clear case.
According to Costco’s own press release, the company reported net sales of $269,912 million plus membership fees of $5,323 million, for total revenue of $275,235 million, or about $275.2 billion. Its net income for the year was $8,099 million, about $8.1 billion.
Costco Wholesale Corporation, Form 8-K press release, September 25, 2025 (SEC filing)
That sounds enormous, and it is. Yet look at how much of each revenue dollar survives:
| Line (fiscal 2025) | Amount (millions) | Per $100 of revenue |
|---|---|---|
| Total revenue | $275,235 | $100.00 |
| Merchandise costs | $239,886 | $87.16 |
| Selling, general and administrative costs | $24,966 | $9.07 |
| Operating income | $10,383 | $3.77 |
| Income taxes | $2,719 | $0.99 |
| Net income | $8,099 | $2.94 |
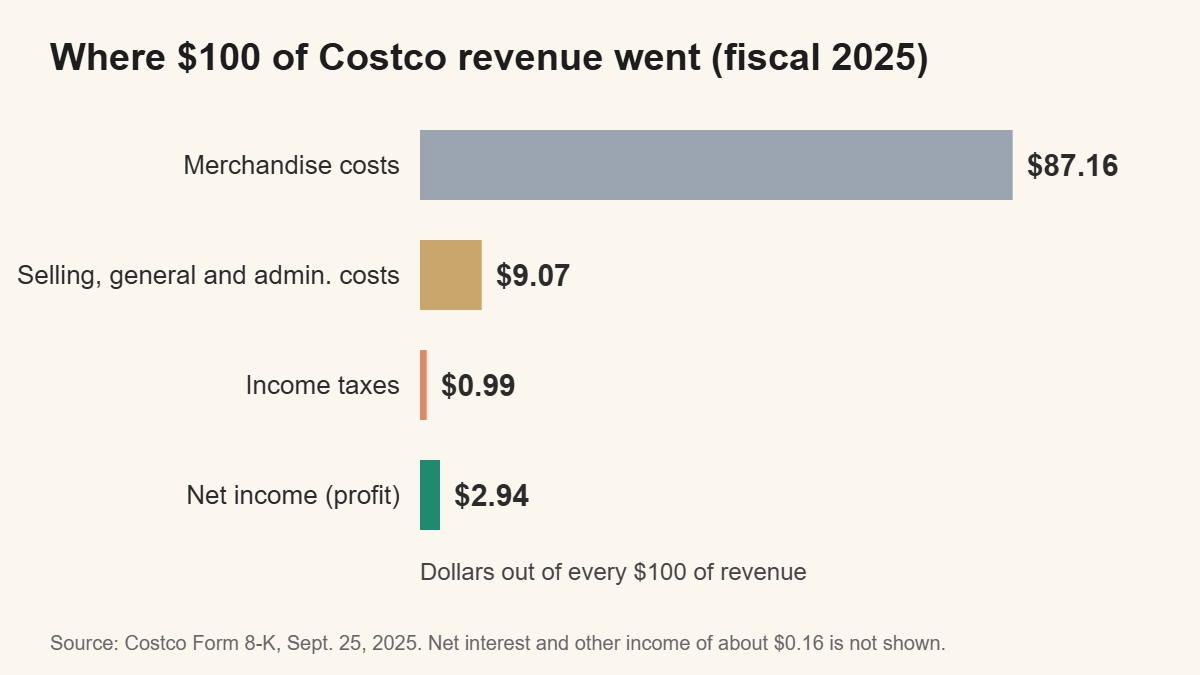
The per-$100 column is our own calculation from the press release figures. It also leaves out about $435 million of net interest and other income, which is why the rows do not add up exactly.
In plain terms, Costco keeps roughly three cents of profit from every dollar customers spend. Compare that with Maple Lane Coffee’s 16 cents. The cart has a higher margin but tiny dollar amounts, while Costco has a thin margin on a gigantic base. Neither revenue nor profit alone tells the full story.
Why Higher Revenue Does Not Always Mean Higher Profit
This is the most expensive misunderstanding in small business. Suppose Maple Lane cuts its drink price from $5 to $4 to attract a crowd, and sales jump 30%. Extra staff cost another $600 for the month.
| Measure | Before | After the discount |
|---|---|---|
| Drinks sold | 4,000 | 5,200 |
| Price per drink | $5.00 | $4.00 |
| Revenue | $20,000 | $20,800 |
| COGS ($1.55 per drink) | $6,200 | $8,060 |
| Gross profit | $13,800 | $12,740 |
| Operating expenses | $9,500 | $10,100 |
| Operating profit | $4,300 | $2,640 |
Revenue rose 4%. Operating profit fell about 39%. The cart got busier and earned less, because every discounted cup brought in $1 less while its ingredients cost the same.
So before chasing sales, always ask what each extra dollar of revenue will cost to earn.
How Much Revenue Do You Need to Break Even?
Break-even is the point where profit is exactly zero. For Maple Lane, each drink adds $3.45 after its ingredients ($5.00 minus $1.55). The $9,500 of operating expenses has to be covered first.
Let x be the number of drinks sold. Here, a variable in math simply stands for that unknown count. Setting operating profit to zero gives a straight-line equation:
3.45x minus 9,500 = 0
x = 9,500 ÷ 3.45 ≈ 2,754 drinks
Break-even revenue = 2,754 × $5 = $13,770
Below about 2,754 drinks a month, the cart loses money at the operating level. This kind of straight-line problem is covered in our guide to linear equations. For simplicity, this break-even ignores interest and taxes.
Common Myths About Revenue and Profit
| Myth | Reality |
|---|---|
| Revenue and profit mean the same thing. | Revenue is money earned before costs. Profit is what remains after costs. |
| More sales always means more profit. | Not if costs rise faster than sales, as the discount example showed. |
| Gross profit is the final profit. | Gross profit only removes direct costs. Rent, wages, interest and taxes still come off. |
| Profit is the same as cash in the bank. | Profit is an accounting result. Depending on the method used, a sale can count as revenue before the customer’s money arrives. |
| A big profit number means a strong margin. | Costco earned about $8.1 billion yet kept only about 3 cents per revenue dollar. Always check the margin too. |
Frequently Asked Questions
Is revenue the same as profit?
No. Revenue is the total money a business earns from sales before costs. Profit is the money left after all costs are subtracted. A company can have large revenue and small profit, or even a loss, if its expenses are high.
Can a company have high revenue and still lose money?
Yes. If total costs are greater than revenue, the result is a loss. This happens when a business spends heavily on ingredients, staff, advertising or interest. A busy shop with deep discounts can easily bring in a lot of revenue and still end the month in the red.
What is another name for revenue?
Revenue is often called sales or the top line. In the United Kingdom and some other countries, the word turnover is also common. Net profit goes by net income or net earnings, which is why you should always check which line a report is describing.
Which is more important, revenue or profit?
Both matter, but they answer different questions. Revenue shows demand and growth. Profit shows whether the business can pay its costs and keep going. Over the long run, a business needs profit to survive, while revenue alone only proves people are buying.
What is the difference between gross profit and net profit?
Gross profit is revenue minus the direct cost of the goods sold. Net profit goes further and also subtracts operating expenses, interest and taxes. For Maple Lane Coffee, gross profit was $13,800 while net profit was $3,200 on the same $20,000 of revenue.
How do you calculate profit margin?
Divide profit by revenue, then multiply by 100 to get a percentage. Maple Lane’s net profit margin is $3,200 divided by $20,000, times 100, which equals 16%. You can do the same with gross profit or operating profit to get gross or operating margin.
Conclusion
Revenue measures how much a business sells, and profit measures how much it keeps. They sit at opposite ends of the same income statement, and the costs in between decide how much of one becomes the other. Track a few months of results and the mean in statistics gives you a typical monthly profit to compare against.
Here is a rule of thumb to carry with you: before you celebrate a sales number, ask what it cost to earn it.
References
- U.S. Securities and Exchange Commission, “Beginners’ Guide to Financial Statements”, published January 12, 2014.
- Costco Wholesale Corporation, “Costco Wholesale Corporation Reports Fourth Quarter and Fiscal Year 2025 Operating Results”, Form 8-K Exhibit 99.1, September 25, 2025.
Disclaimer
This article is for general educational purposes only. The coffee cart scenario and its figures are illustrative, and the Costco figures come from the company’s unaudited press release. Nothing here is financial, tax or investment advice. For decisions about your own business, consult a qualified accountant or financial professional.