Your bus is late again. Over one week it shows up 4, 7, 5, 9 and 5 minutes behind schedule. A statistician could describe that spread in two ways: a variance and standard deviation. The variance comes out to 4 and the standard deviation to 2. Same data, same spread, two different numbers.
So which one should you trust? Both, as it turns out, but for different jobs. The standard deviation speaks the language of your data (minutes late). The variance speaks the language of formulas, where squared numbers make the math work.
This guide puts the two side by side. You’ll see how they’re linked, why one is the square of the other, what happens to each when you change units, and a simple rule for picking the right one.
Quick Info
| Topic | Detail |
|---|---|
| Short answer | Standard deviation is the square root of variance |
| Variance | Average squared distance from the mean, in squared units |
| Standard deviation | Typical distance from the mean, in the original units |
| Key formulas | s² = Σ(x − x̄)² ÷ (n − 1) and s = √s² |
| Report to people | Standard deviation |
| Use inside math | Variance (it adds cleanly across independent sources) |
| Reading time | About 10 minutes |
Variance and Standard Deviation: The Core Difference
Both numbers answer the same question: how far do the values usually sit from the average? They just answer it on different scales.
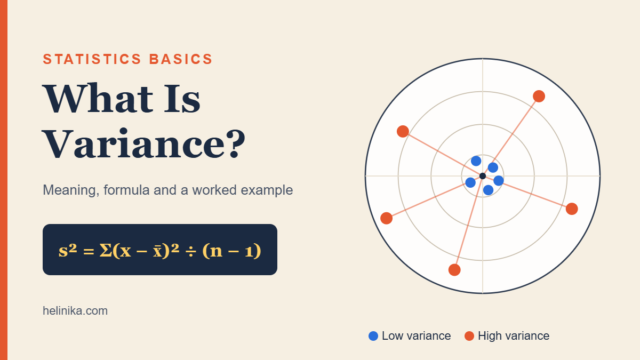
Variance is the average of the squared distances from the mean. Standard deviation is the square root of that average, which brings the answer back to the original units.
If you’re new to either idea, our guides on what variance is and what standard deviation is explain each one from scratch. This article focuses on how they compare.
One idea, two scales
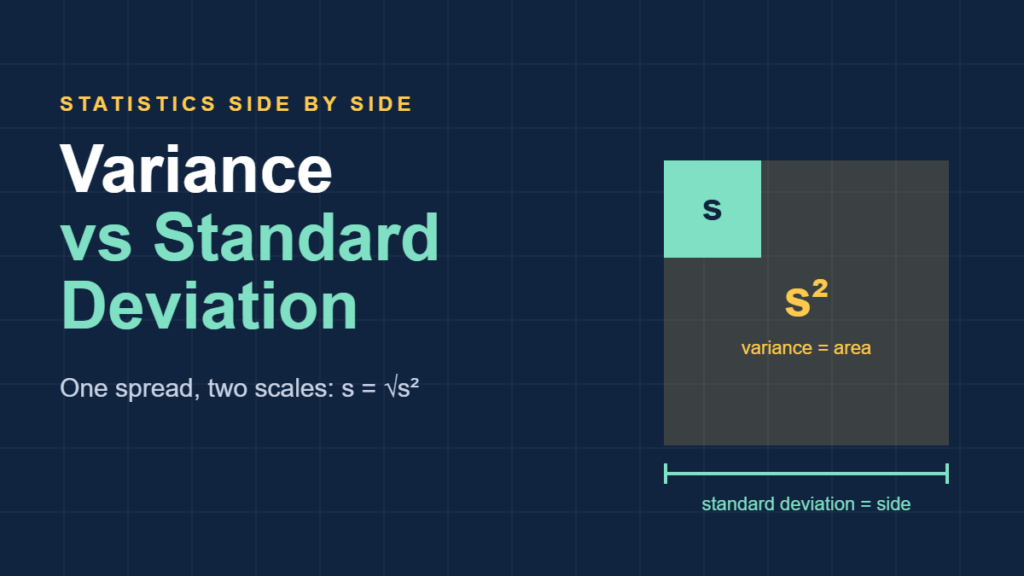
Think of a square garden plot. You can describe its size by the length of one side (10 feet) or by its area (100 square feet). Both are correct. The side length is easier to picture, while the area is what you need to buy grass seed.
Standard deviation is the side length. Variance is the area.
Side-by-side comparison
| Feature | Variance | Standard deviation |
|---|---|---|
| Symbol (sample) | s² | s |
| Symbol (population) | σ² | σ |
| Units | Squared (minutes², dollars²) | Same as the data (minutes, dollars) |
| Easy to picture? | No | Yes |
| Can be negative? | No | No |
| Adds across independent sources? | Yes | No |
| Effect of doubling every value | Multiplies by 4 | Multiplies by 2 |
| Best for | Formulas, models, ANOVA | Describing and reporting spread |
How Variance and Standard Deviation Are Connected
The link is one step long. Find the variance first, then take its square root.
Standard deviation = √(Variance)
Variance = (Standard deviation)²
Every calculator, spreadsheet and statistics package follows this order. Nobody computes standard deviation “directly.” It always passes through the variance on the way.
The sample formulas
s² = Σ(x − x̄)² ÷ (n − 1)
s  = √[ Σ(x − x̄)² ÷ (n − 1) ]
- x is each value in your data.
- x̄ is the mean of the values.
- Σ means “add them all up.”
- n is the number of values.
Population or sample?
When your data covers everyone you care about (a full population), you divide by n and use the Greek symbols σ² and σ. When your data is only a sample drawn from something bigger, you divide by n − 1.
The n − 1 version is the one you’ll use most of the time. Penn State’s graduate statistics notes explain that dividing by n − 1 makes the sample variance an unbiased estimate of the population variance, meaning it doesn’t run low on average.
Penn State STAT 505: Measures of Dispersion
One detail trips people up here: the square root of an unbiased variance is not perfectly unbiased for σ. The bias is small, and in everyday work nobody worries about it, but it’s a neat example of how squaring and square-rooting change a number’s behavior.
Worked Example: The Late Bus
Let’s run the bus data all the way through. Here are the minutes late for five weekday trips: 4, 7, 5, 9, 5.
Step 1: Find the mean
Add the values and divide by how many there are.
(4 + 7 + 5 + 9 + 5) ÷ 5 = 30 ÷ 5 = 6 minutes
Step 2: Find each deviation
Subtract the mean from each value: −2, 1, −1, 3, −1. These add to zero, which is always true and a handy self-check.
Step 3: Square the deviations
| Trip | Minutes late (x) | x − x̄ | (x − x̄)² |
|---|---|---|---|
| Monday | 4 | −2 | 4 |
| Tuesday | 7 | 1 | 1 |
| Wednesday | 5 | −1 | 1 |
| Thursday | 9 | 3 | 9 |
| Friday | 5 | −1 | 1 |
| Total | 30 | 0 | 16 |
Step 4: Divide by n − 1 to get the variance
s² = 16 ÷ (5 − 1) = 16 ÷ 4 = 4 minutes²
Step 5: Take the square root to get the standard deviation
s = √4 = 2 minutes
Step 6: Put both into words
The variance says the average squared miss is 4 “square minutes.” That’s a real number, but try picturing a square minute. You can’t.
The standard deviation says the bus is typically about 2 minutes away from its usual 6 minutes late. A rider can use that sentence. That’s the whole case for reporting standard deviation.
What Happens When You Change Units?
Here’s where the two numbers part ways, and where most comparison guides stop too early.
Suppose a transit analyst records the same delays in seconds instead of minutes. Every value gets multiplied by 60: 240, 420, 300, 540, 300.
| Measure | In minutes | In seconds | Change |
|---|---|---|---|
| Mean | 6 | 360 | × 60 |
| Standard deviation | 2 | 120 | × 60 |
| Variance | 4 | 14,400 | × 3,600 |
The standard deviation grows by the same factor as the data. The variance grows by that factor squared. A variance of 14,400 sounds alarming, yet the bus is exactly as reliable as before. Nothing changed except the ruler.
Now try adding a constant instead. If the driver leaves 10 minutes later every day, the delays become 14, 17, 15, 19, 15. The mean jumps to 16, but the variance stays 4 and the standard deviation stays 2. Shifting everything by the same amount doesn’t change the spread at all.
Try it: stretch and shift the data
Use the slider to multiply every delay, and the button to add 10 minutes to all of them. Watch how the standard deviation bar grows in step with the data while the variance bar races ahead.
Dots: the five delays. Shaded band: mean ± 1 standard deviation. Bars: SD grows in step with the slider, variance grows with its square. Adding 10 minutes moves the dots but leaves both bars alone.
The two rules to remember
- Multiply the data by k: standard deviation × k, variance × k².
- Add a constant c: standard deviation and variance both stay the same.
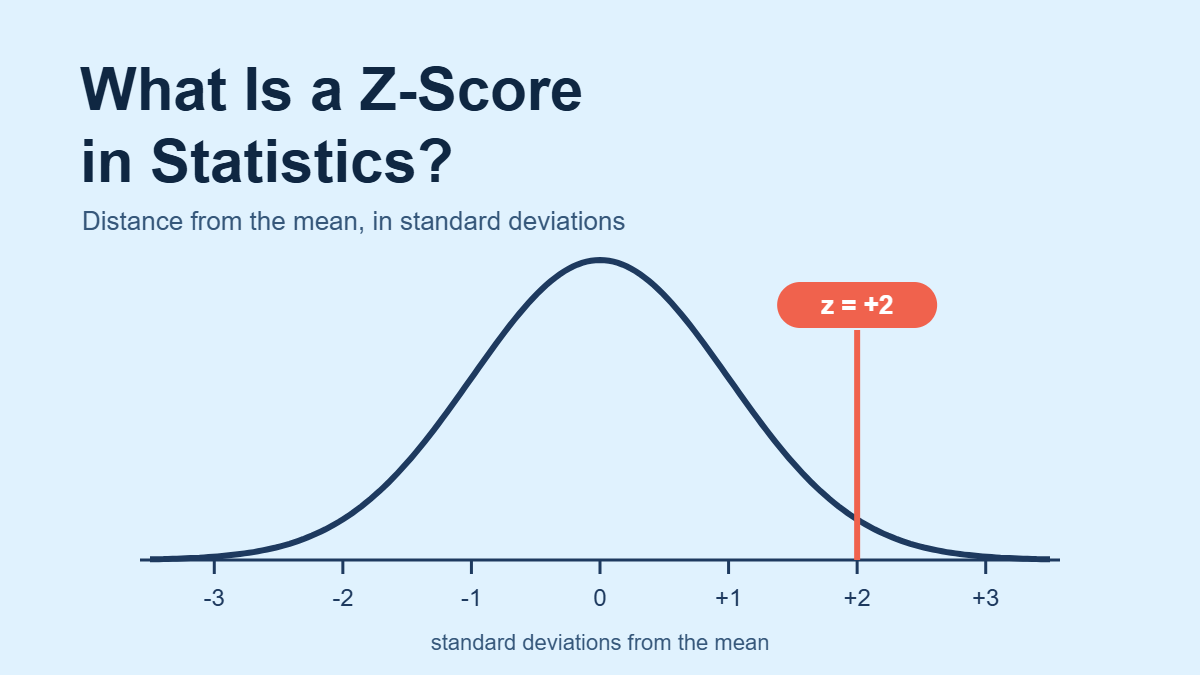
These rules explain why you should never compare raw variances measured in different units, and why a z-score divides by the standard deviation rather than the variance. Dividing by s cancels the units cleanly.
When to Use Variance vs Standard Deviation
Here’s a quick decision guide.
| Your situation | Use | Why |
|---|---|---|
| Describing spread in a report or chart | Standard deviation | Same units as the data, easy to read |
| Comparing spread of two groups in the same units | Either, but SD reads better | Both rank the groups the same way |
| Adding up risk or error from independent sources | Variance | Variances add; standard deviations don’t |
| Running ANOVA or regression | Variance | Those methods split total variance into parts |
| Calculating z-scores or the 68-95-99.7 rule | Standard deviation | Both are built on SD units |
| Setting error bars | Standard deviation (or standard error) | Matches the axis units |
Why variances add and standard deviations don’t
Imagine your commute has two independent legs: a bus ride with a standard deviation of 3 minutes and a train ride with a standard deviation of 4 minutes. How much does the full trip vary?
Adding the standard deviations gives 7, which overstates it. Add the variances instead:
Total variance = 3² + 4² = 9 + 16 = 25
Total standard deviation = √25 = 5 minutes
It’s the Pythagorean theorem in disguise. This “add the squares” rule is why variance does so much behind-the-scenes work in statistics, even though standard deviation gets the headlines. Our variance guide goes deeper into this property.
How Outliers Affect Each One
Both measures react strongly to extreme values, because both square the distances. Change Thursday’s delay from 9 minutes to 25 and see what happens:
| Data | Mean | Variance | Standard deviation |
|---|---|---|---|
| 4, 7, 5, 9, 5 | 6 | 4 | 2 |
| 4, 7, 5, 25, 5 | 9.2 | 79.2 | 8.90 |
One bad day multiplied the variance by about 20 and the standard deviation by about 4.5. The variance looks more dramatic, but that’s only because it’s on the squared scale. In relative terms, both have been pulled hard by one value.
NIST’s Engineering Statistics Handbook warns that variance “can be greatly affected by the tail behavior” and recommends standard deviation as a scale measure mainly when data look roughly normal.
NIST/SEMATECH e-Handbook: Measures of Scale
When your data has heavy outliers, consider the interquartile range instead. It ignores the extreme 25% at each end, so one wild value can’t hijack it. The simple range sits at the other extreme: it depends only on the two most extreme values.
Common Mistakes and Myths
| Myth | Reality |
|---|---|
| “Variance and standard deviation measure different things.” | They measure the same spread on two scales. |
| “A bigger variance always means a bigger problem.” | Not if the units differ. Seconds² will dwarf minutes² for the same data. |
| “You can average two standard deviations to combine groups.” | You combine variances (weighted), then take the square root. |
| “Standard deviation is the average distance from the mean.” | Close, but it’s the square root of the average squared distance, which weights big misses more. |
| “Variance can be negative when data is below the mean.” | Squared values are never negative, so neither is variance. |
| “Adding 10 to every value increases the spread.” | Shifting all values moves the mean but leaves both measures unchanged. |
Frequently Asked Questions
What is the main difference between variance and standard deviation?
Variance is the average squared distance from the mean, so it’s in squared units like minutes² or dollars². Standard deviation is the square root of the variance, which puts it back in the data’s original units. They describe the same spread, but standard deviation is far easier to read and explain.
Is standard deviation always smaller than variance?
No. It depends on whether the variance is above or below 1. When the variance is 4, the standard deviation is 2 (smaller). When the variance is 0.25, the standard deviation is 0.5 (larger). When the variance is exactly 1, both are equal. The size comparison itself doesn’t carry any meaning.
Why do statisticians use variance at all if SD is easier?
Because variance has cleaner math. Variances of independent quantities add together directly, and methods such as ANOVA and regression work by splitting total variance into pieces. Statisticians often calculate with variance, then convert to standard deviation at the end to report results in readable units.
How do I convert variance to standard deviation?
Take the square root. A variance of 49 gives a standard deviation of 7. To go the other way, square the standard deviation: a standard deviation of 1.5 gives a variance of 2.25. Make sure you’re using the same version (sample or population) for both.
Which is better for comparing two datasets?
If both datasets use the same units, either works and they’ll rank the spreads the same way, though standard deviation is easier to talk about. If the units or averages differ a lot, compare the coefficient of variation instead, which divides the standard deviation by the mean.
Do variance and standard deviation change if I add a constant?
No. Adding or subtracting the same amount from every value shifts the whole dataset without changing how spread out it is. The mean moves, but the variance and standard deviation stay exactly the same. Multiplying by a constant is different: it scales both.
Conclusion
Variance and standard deviation are two views of the same spread. Variance squares the distances, which makes it ideal for formulas, for adding independent sources of variation and for methods like ANOVA. Standard deviation takes the square root, bringing the number back into units that people can picture and use.
A handy rule: calculate with variance, talk with standard deviation. If someone hands you a variance, take its square root before you try to explain what it means.
Disclaimer
This article is for general educational purposes only. The bus and commute figures in the examples are illustrative. For research or professional analysis, consult a qualified statistician.