

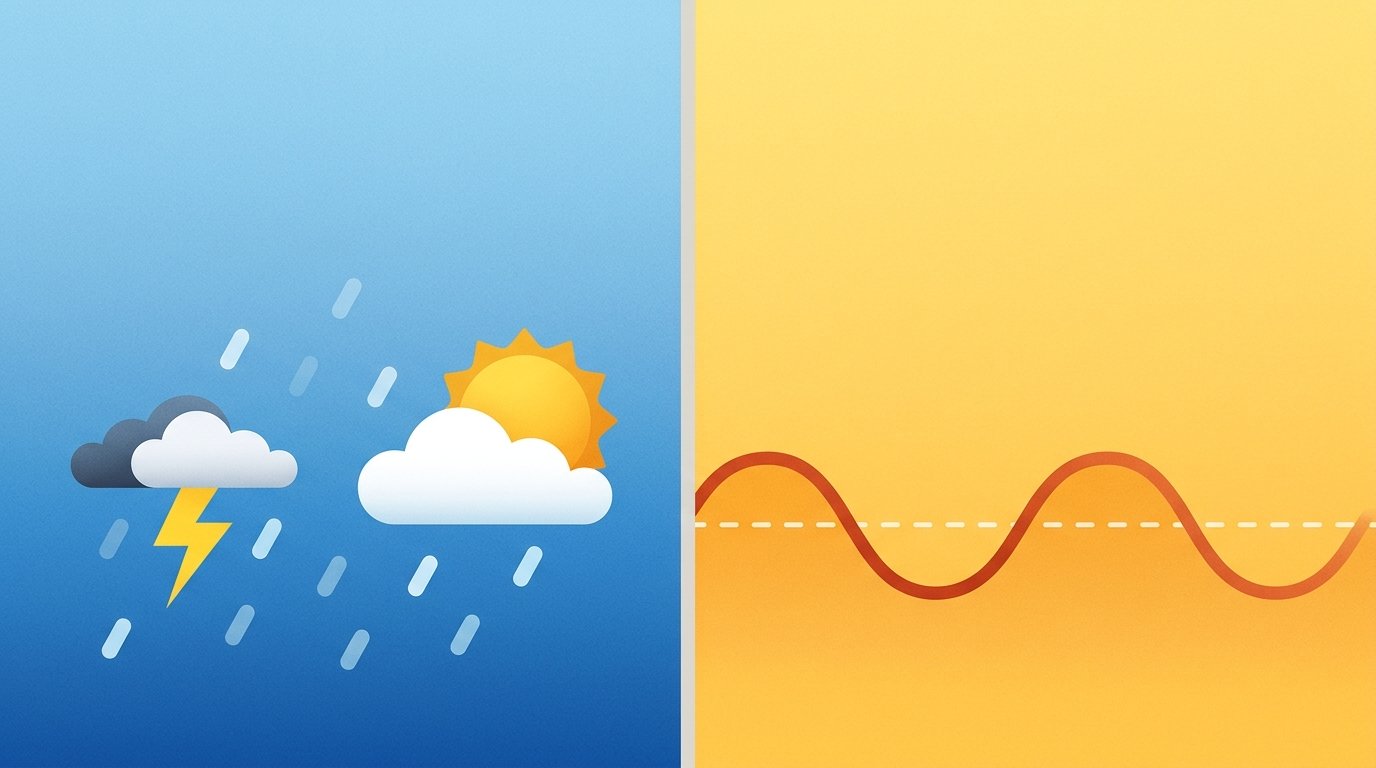
The difference between weather and climate comes down to time. Weather is what the atmosphere is doing right now or over the next few days. Climate is the typical pattern for a place, averaged over 30 years or more.
Picture two questions. “Do I need an umbrella today?” is a weather question. “Does this city get a lot of rain?” is a climate question.
People mix the two up all the time, especially when a cold snap or a heat wave makes headlines. Getting them straight helps you read forecasts, news stories and science reports with more confidence.
This guide defines each term, compares them side by side, walks through a real NOAA example from Texas, and finishes with a worked calculation, a chart and a quick test you can use on any claim.
Quick Info
| Topic | Detail |
|---|---|
| Short answer | Weather is short-term conditions; climate is the long-term average, usually 30 years or more |
| Weather timescale | Minutes, hours and days (it can also be tallied weekly or monthly) |
| Climate timescale | 30 years or more (current U.S. normals cover 1991 to 2020) |
| Key idea | Climate is what you expect; weather is what you get |
| Common mistake | Treating one hot or cold day as proof about climate |
| Best test | Ask how long a period the statement covers |
| Reading time | About 9 minutes |
What Is Weather?
Weather is the state of the atmosphere at a particular place over a short time. It covers things you can feel or see right now: temperature, wind, rain, snow, humidity and cloud cover.
Weather changes fast and can differ from one spot to the next. NOAA’s education team gives a simple picture: weather is tracked within hours or days, and it might rain at your house while a school a few blocks away stays dry.
You have probably watched weather change in front of you. If you’ve seen the sky go dark before a storm, our post on why clouds turn black before it rains explains what is happening overhead.
What Is Climate?
Climate is the average weather of a place over a long period. Instead of asking what happened today, it asks what is typical, and how much that typical pattern varies.
According to NOAA, climate is the average of weather patterns in a location over a longer time, usually 30 years or more. NOAA lists examples of climate measures such as land and sea temperature, rainfall totals, the date of the first frost, sea ice melt and sea level.
Scientists store those long-term averages as climate normals. The NOAA JetStream guide to climate vs. weather says the current U.S. normals cover 1991 to 2020, and that a new set based on 2001 to 2030 is scheduled for 2031.
Weather vs Climate at a Glance
| Feature | Weather | Climate |
|---|---|---|
| Time span | Hours to days | 30 years or more |
| What it describes | Conditions at a moment | Typical conditions and how much they vary |
| How fast it changes | Quickly, even within a single day | Slowly, over decades or longer |
| Place | Can differ between nearby spots | Usually described for a region |
| Example | A thunderstorm this afternoon | Hot, wet summers in a region |
| Question it answers | What should I wear today? | What kind of place is this? |
| Handy tool | A daily forecast | Climate normals |
Why Does Climate Use 30 Years?
One year can be strange. A single summer might be unusually wet, and the next might be bone dry. Averaging three decades smooths out those ups and downs so the typical pattern stands out.
The NOAA JetStream page describes a climate normal as the arithmetic average of values over a 30-year period, generally three consecutive decades. It also makes a useful point: big swings in weather from day to day, month to month or year to year do not necessarily mean a large, rapid change in climate.
A Real US Example: Dallas/Fort Worth in 2015
Real numbers make the idea concrete. NOAA’s JetStream page describes 2015 in the Dallas/Fort Worth area, where annual rainfall reached 62.61 inches against a normal of 36.14 inches. That beat the old all-time record by more than 9 inches.
Let’s check the size of that gap. The difference is 62.61 − 36.14 = 26.47 inches. Dividing 62.61 by 36.14 gives about 1.73, so the area received roughly 73% more rain than normal.
| Measure | 2015 value | Normal |
|---|---|---|
| Annual rainfall | 62.61 inches | 36.14 inches |
| Average temperature on November 27 | 55°F | 52°F |
The same page offers a second lesson. On November 27 the daily average temperature, 55°F, looked close to the 52°F normal. Yet the high of 70°F came around 3 AM and the low of 39°F arrived just before midnight, so the day itself was unusual. An average can hide a wild day, which is why climate and weather need to be read at different scales.
A record-setting year is weather and climate meeting each other. The year is a weather story, while the normal it was compared against is a climate number built from decades of data.
What Shapes the Climate of a Place?
Weather varies from hour to hour, but a place’s climate has deeper causes. NOAA’s education team names latitude as the main driver: near the equator sunlight hits almost directly all year, while at the poles it is weak and strikes at a steep angle for much of the year.
Latitude
Distance from the equator sets the basic temperature pattern. Mid-latitudes sit in between, with moderate climates and seasons that change through the year.
Altitude and mountains
Height changes temperature and rainfall. The same NOAA page says high mountains create high-altitude climates, and that the Big Island of Hawaii has about 10 or 11 climate zones in roughly 4,000 square miles. If you’re curious how tall landforms are defined, our guide to the difference between a mountain and a hill is a good companion read.
Nearness to oceans
Oceans store and move heat, so coastal and inland places at the same latitude often have different climates. To see how much water covers the planet, read our post on how many oceans there are in the world.
Climatologists group these patterns into climate zones, mainly by average temperature and precipitation. Tundra, desert and rain forest are three examples.
A Worked Example: Two Weeks of Weather, One Climate Normal
Let’s use an invented city to see how the two ideas fit together. All numbers below are illustrative, not real measurements.
Step 1: Record the daily highs
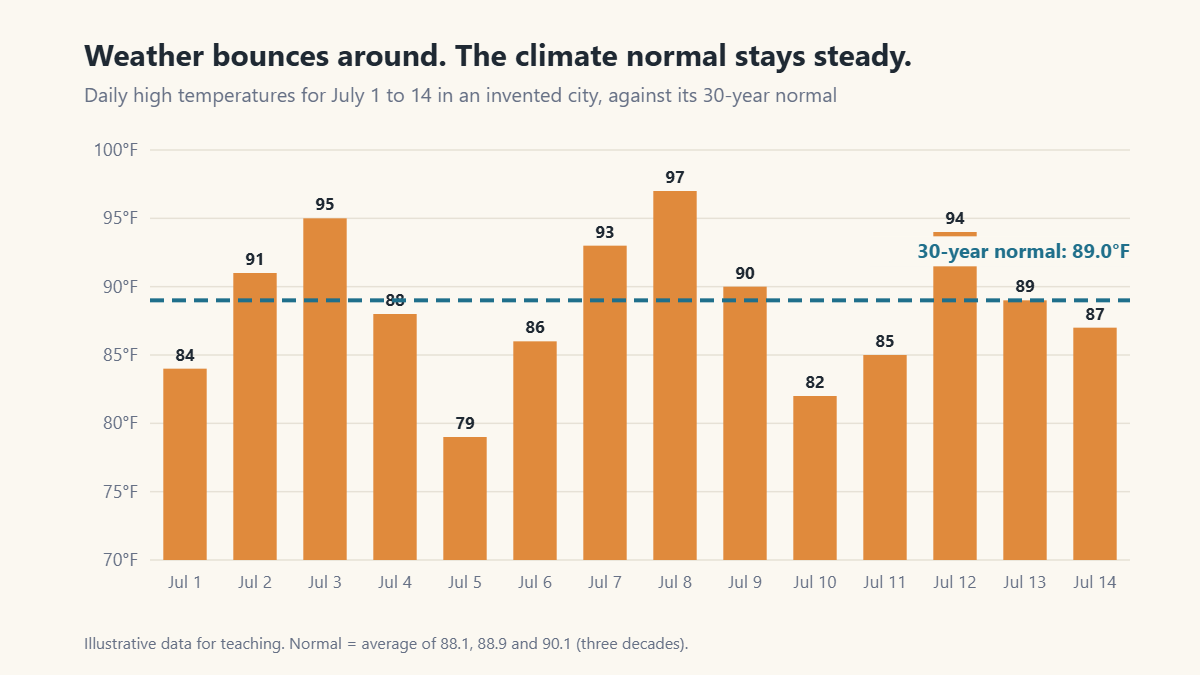
Here are the daily high temperatures (°F) for July 1 to 14: 84, 91, 95, 88, 79, 86, 93, 97, 90, 82, 85, 94, 89, 87.
Step 2: Look at the swings (weather)
The hottest day reached 97°F and the coolest only 79°F. That is a spread of 97 − 79 = 18°F in two weeks. This up-and-down pattern is weather.
Step 3: Average the two weeks
The 14 highs add up to 1,240. Dividing by 14 gives 1,240 ÷ 14 ≈ 88.6°F.
Step 4: Compare with the climate normal
Suppose the average July high was 88.1°F in the 1990s, 88.9°F in the 2000s and 90.1°F in the 2010s. Averaging the three decades gives (88.1 + 88.9 + 90.1) ÷ 3 ≈ 89.0°F. That steady 89.0°F is the climate normal for July highs.
The hottest day, July 8, was 97 − 89.0 = 8°F above normal. It felt extreme, yet the two-week average of 88.6°F landed within half a degree of the normal.
Weather or Climate? A Three-Question Test
Use this quick test when you read a headline or hear a claim.
| Question | If the answer is yes | Example |
|---|---|---|
| Does it cover hours or days? | Weather | “Tomorrow’s high will be 82°F” |
| Is it an average over about 30 years or more? | Climate | “July highs here average 89°F” |
| Does it describe one storm, one heat wave or one cold snap? | Weather | “Hail hit the town last night” |
A claim about whether such events are becoming more or less frequent over decades is a climate question, even though each individual event is weather.
Weather, Climate Change and Global Warming
You will often see these terms together, so a short note helps. NOAA explains that global warming is one aspect of climate change. It refers to the rise in global average near-surface temperatures, while climate change is broader and covers long-lasting shifts in measures such as precipitation, wind patterns and sea ice extent.
That is why scientists compare long records instead of single days. Weather supplies the daily data, and climate is what emerges when decades of it are averaged.
Common Myths About Weather and Climate
| Myth | Reality |
|---|---|
| One cold day (or one hot day) settles the argument about climate | A single day is weather. Climate is judged over decades, and large day-to-day swings do not by themselves signal a large, rapid climate change |
| Weather and climate are two names for the same thing | They differ in timescale and in what they describe: conditions at a time versus long-term averages |
| Climate is the same everywhere | Climate varies by place, from tundra to desert to rain forest, and the Big Island of Hawaii alone has about 10 or 11 zones |
| Climate is only a global idea | Climate can be described for a small area, such as one island’s zones, as well as for a region or the whole planet |
| A record year instantly rewrites the normal | Normals are 30-year averages issued on a schedule; the next U.S. set, based on 2001 to 2030, is due in 2031 |
Frequently Asked Questions
What is the simplest way to tell weather and climate apart?
Look at the time span. Weather covers hours to days, while climate describes the typical pattern over 30 years or more. If a statement is about what is happening now or this week, it is weather. If it is about what is normal for a place, it is climate.
How many years does a climate average cover?
Scientists usually use 30 years or more. NOAA describes a climate normal as the arithmetic average over a 30-year period, generally three consecutive decades. The current U.S. normals use 1991 to 2020.
Can the weather be unusual while the climate stays the same?
Yes. A place can have a record-wet year, as Dallas/Fort Worth did in 2015, and still have the same long-term climate normal. One unusual year is a data point inside a much larger record.
Is a heat wave weather or climate?
A single heat wave is a weather event. Whether heat waves are becoming more or less common over several decades is a climate question. The first is about one episode, and the second needs a long record to answer.
Who studies weather and who studies climate?
Meteorologists study and forecast weather, while climatologists study long-term patterns. Their work overlaps because climate is built from weather records, and NOAA says many U.S. locations have kept such records for more than 140 years.
Does every place in the United States have the same climate?
No. Climate depends on latitude, altitude and nearness to water, among other things. NOAA’s education team points out that even one island, the Big Island of Hawaii, has about 10 or 11 climate zones.
Conclusion
Weather is the short-term state of the atmosphere, and climate is the long-term average built from it. One changes by the hour, and the other is measured in decades.
Next time you hear a weather claim, ask one question: how many years of data are behind it?
Disclaimer
This article is for general educational purposes only. The temperatures in the worked example are invented for teaching and do not describe a real city. For local forecasts and weather warnings, check the National Weather Service or your local emergency management agency.