

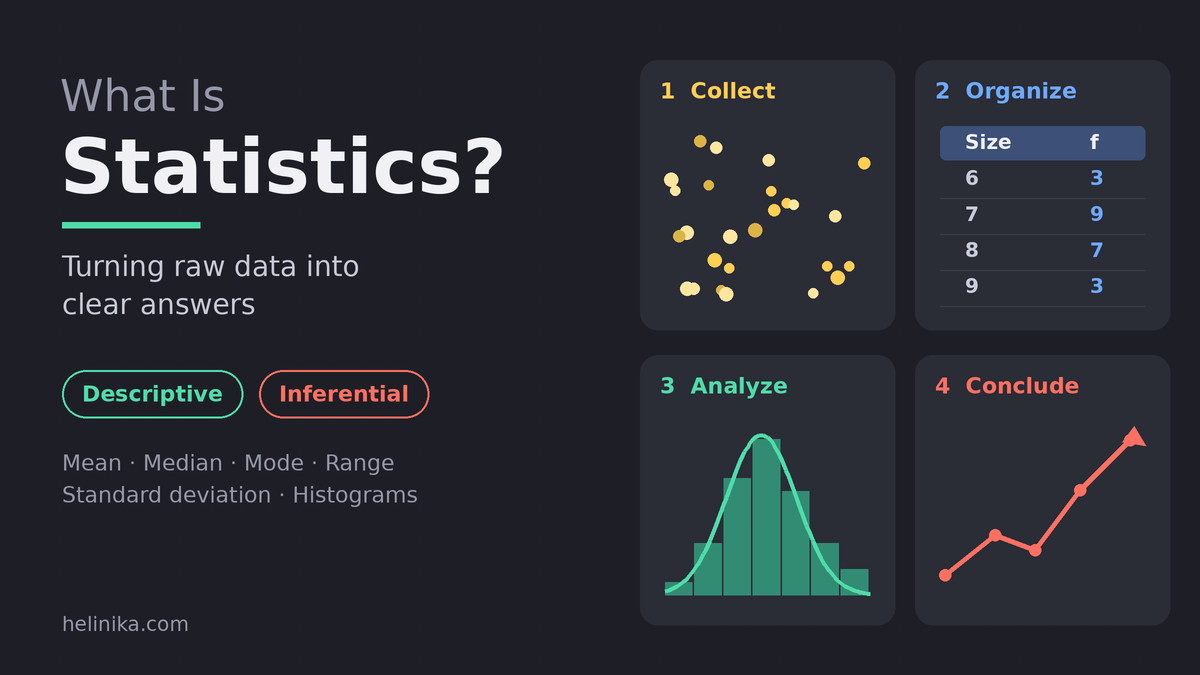
Statistics is the branch of mathematics that deals with collecting, organizing, analyzing, interpreting, and presenting data. It helps people understand information, identify patterns, compare results, and make decisions based on evidence.
For example, a teacher can use students’ test scores to calculate the class average. A weather service can analyze past and current conditions to estimate the chance of rain. A business can study monthly sales to understand which products customers prefer. In each case, statistics turns raw information into something useful.
In this guide, you will learn what statistics means, the main types of statistics, how statistical analysis works, and how statistics is used in everyday life.
A Simple Definition of Statistics
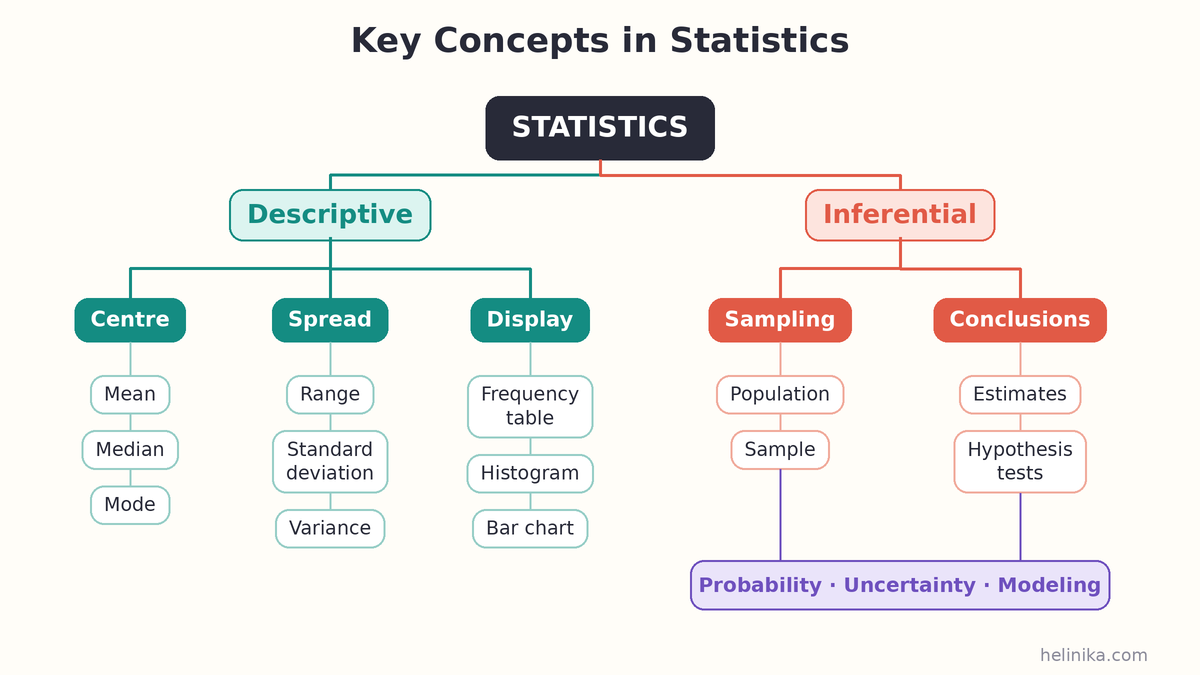
Statistics is the systematic study of data. It includes methods for gathering information, arranging it in a meaningful way, summarizing it, and drawing conclusions from it.
The word “statistics” is also used in two related ways:
- Statistics as a field of study: the methods and principles used to work with data.
- A statistic as a numerical result: a value calculated from a sample, such as the average age of 50 survey participants.
For example, if five students receive marks of 72, 85, 68, 90, and 75, their average mark is 78. The average is a statistic that summarizes the five results.
Why Is Statistics Important?
Statistics is important because people and organizations often need to make decisions using more information than they can understand by simply looking at individual figures. Statistical methods help summarize large datasets, compare groups, measure uncertainty, and identify patterns.
| Purpose | How statistics helps | Example |
| Summarizing information | Turns many observations into understandable measures. | Finding the average score of a class. |
| Comparing groups | Shows similarities and differences between groups. | Comparing sales in two months. |
| Finding patterns | Helps identify trends and relationships. | Studying changes in population over time. |
| Making estimates | Uses sample information to estimate larger groups. | Surveying voters to estimate public opinion. |
| Supporting decisions | Provides evidence for planning and evaluation. | A hospital reviewing patient waiting times. |
What Are the Two Main Types of Statistics?
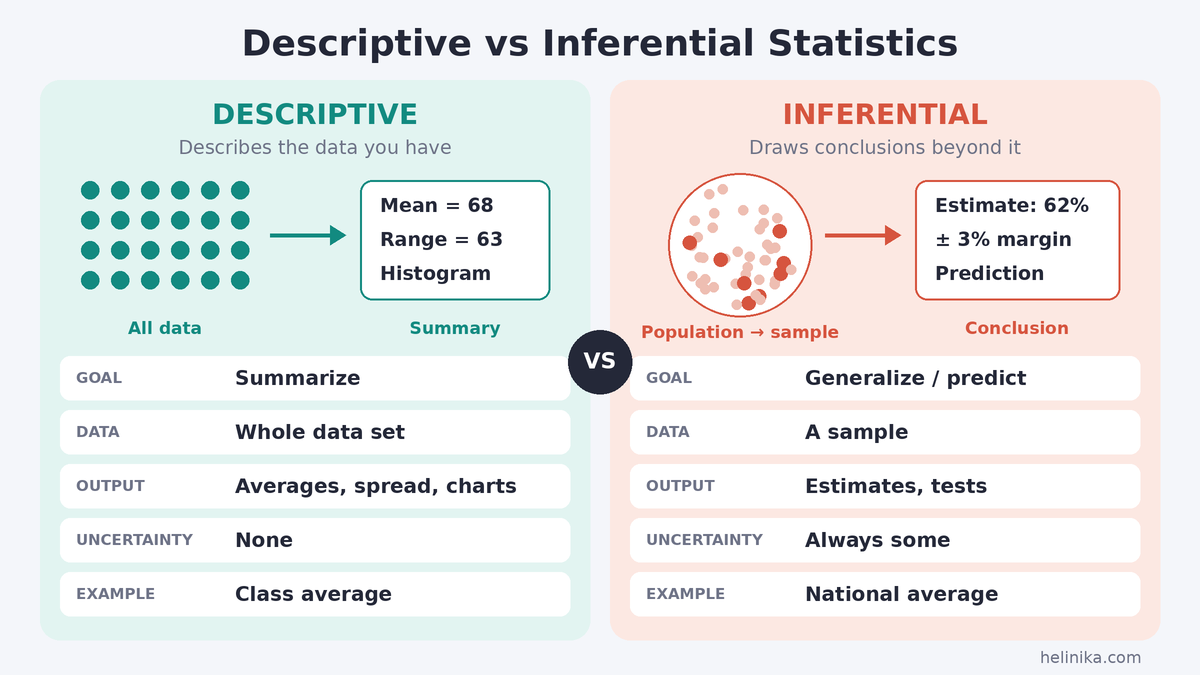
The two main branches of statistics are descriptive statistics and inferential statistics. They are connected, but they answer different questions.
1. Descriptive Statistics
Descriptive statistics organizes and summarizes the data that has been collected. It describes what the available data shows without automatically making claims about a larger population.
Common descriptive tools include the mean, median, mode, range, standard deviation, tables, charts, and graphs.
Example: A teacher records the marks of 30 students and calculates the class average. The average describes the performance of those 30 students.
2. Inferential Statistics
Inferential statistics uses information from a sample to make estimates, test ideas, or draw conclusions about a larger population. Because only part of the population is usually studied, inferential statistics also considers uncertainty.
Example: A polling organization surveys 1,000 adults to estimate the opinions of a much larger population. The survey result is an estimate, not a guarantee that every person has the same opinion.
| Feature | Descriptive Statistics | Inferential Statistics |
| Main purpose | Summarizes observed data. | Draws conclusions about a wider population. |
| Data used | The dataset being described. | Usually a sample from a population. |
| Typical tools | Mean, median, mode, range, charts. | Estimation, confidence intervals, hypothesis tests. |
| Example question | What was the average score in this class? | What might the average score be across all schools? |
Population, Sample, Parameter, and Statistic
To understand inferential statistics, it helps to know four basic terms:
- Population: the complete group a researcher wants to study. It could be all students in a school or all customers of a company.
- Sample: a smaller group selected from the population to collect information.
- Parameter: a numerical value that describes a population, such as the true average age of all students in a school.
- Statistic: a numerical value calculated from a sample, such as the average age of 100 selected students.
A well-selected sample can provide useful information about a population. However, a sample may not represent the population perfectly, so conclusions should be interpreted with care.
Types of Data Used in Statistics
Statistical analysis depends on the kind of information being collected. A common distinction is between qualitative and quantitative data.
Qualitative Data
Qualitative data describes qualities or categories rather than measuring an amount. Examples include a person’s preferred phone brand, a product’s color, or a survey response such as “satisfied” or “unsatisfied.”
Quantitative Data
Quantitative data is numerical and represents a count or measurement. Examples include age, height, monthly income, number of website visits, and test scores.
| Data type | Meaning | Examples |
| Qualitative | Describes categories or characteristics. | Eye color, device brand, customer feedback. |
| Quantitative — discrete | Countable numerical values, often whole numbers. | Number of books, calls, or students. |
| Quantitative — continuous | Measurements that can take many values within a range. | Height, weight, temperature, and time. |
How Does the Statistical Process Work?
A statistical study usually follows a sequence of steps. The exact process can vary by project, but the following outline explains the main stages.
- Define the question: Decide what you want to understand or measure.
- Collect data: Gather relevant information through surveys, observations, experiments, records, or other suitable methods.
- Organize the data: Check, classify, and arrange the information in a useful format.
- Analyze the data: Use appropriate statistical methods, such as averages, percentages, charts, or statistical tests.
- Interpret and communicate the results: Explain what the findings mean, acknowledge limitations, and present conclusions clearly.
Example: Imagine a school wants to explore whether students’ sleep duration is related to their exam performance. It could collect sleep and exam-score information from a group of students, organize the results, calculate averages, and compare the groups.
For illustration only, suppose 54 students who reported sleeping at least eight hours had an average score of 74, while 66 students who reported sleeping fewer than eight hours had an average score of 66. This difference may be worth investigating, but it does not prove that sleep duration alone caused the difference. Other factors, such as study time, health, and exam difficulty, may also matter.
Other Important Areas of Statistics
Descriptive and inferential statistics are the two main branches, but several other areas provide tools used in statistical work.
| Area | What it covers | Simple example |
| Probability | Studies uncertainty and the likelihood of events. | Estimating the chance of rain. |
| Sampling methods | Explains how to select observations from a population. | Selecting students from different grades for a survey. |
| Statistical modeling | Uses mathematical relationships to describe data or make predictions. | Modeling how sales change with price. |
| Experimental design | Plans how to collect data to compare treatments or conditions fairly. | Comparing two teaching methods using suitable groups. |
Uses of Statistics in Different Fields
1. Education
Schools and universities use statistics to review exam results, attendance, graduation rates, and student progress. Teachers may use class averages and score distributions to identify topics that need more attention.
2. Healthcare
Healthcare researchers analyze patient information, treatment outcomes, disease patterns, and clinical-trial results. Statistical methods help evaluate whether observed differences are meaningful, while medical decisions also require clinical judgment.
3. Business and Marketing
Businesses use sales figures, customer surveys, website analytics, and market research to understand customer behavior. For example, a store may compare monthly sales to identify seasonal demand.
4. Government and Public Planning
Government departments use statistical information about population, employment, education, housing, and public services. These figures can support planning and help measure changes over time.
5. Sports
Sports teams and analysts use statistics to review player performance, team results, scoring rates, and match trends. A cricket analyst, for example, may compare a batter’s strike rate across different match situations.
6. Scientific Research
Researchers use statistics to design studies, analyze observations, test hypotheses, and communicate uncertainty. Statistical analysis helps researchers distinguish patterns in the data from conclusions that the evidence cannot support.
Everyday Examples of Statistics
| Situation | Data collected | Possible statistical use |
| Student performance | Marks from several tests. | Calculate the average and compare progress. |
| Weather forecast | Historical and current weather observations. | Estimate the probability of rain. |
| Business sales | Daily or monthly sales records. | Identify trends and compare products. |
| Population survey | Responses from a selected group of people. | Estimate characteristics or opinions in a larger group. |
| Personal spending | Daily expenses by category. | Calculate totals and identify where money is spent. |
A weather forecast that reports a 30% chance of rain does not mean that it will rain for exactly 30% of the day. It expresses a probability for a defined forecast area and period, based on the forecasting method and available evidence.
Statistics vs. Data: What Is the Difference?
Data is the raw information collected for a purpose. Statistics refers to the methods used to organize and analyze that information, as well as numerical summaries calculated from it.
| Term | Meaning | Example |
| Data | Individual observations or recorded facts. | 72, 85, 68, 90, 75. |
| Statistic | A numerical summary calculated from data. | The average of these five marks is 78. |
In short, data provides the information, while statistics helps make sense of it.
Statistics vs. Mathematics
Mathematics is a broad field that includes numbers, structures, patterns, quantities, and logical relationships. Statistics is a field that uses mathematical ideas to collect, analyze, interpret, and communicate data.
Statistics often deals with variation and uncertainty in real-world information. Mathematics also includes many areas that do not involve analyzing datasets.
Benefits and Limitations of Statistics
Benefits
- Summarizes large amounts of information in a clear form.
- Helps compare groups, time periods, and outcomes.
- Supports evidence-based planning and decision-making.
- Helps researchers measure uncertainty and evaluate claims.
Limitations
- Poor-quality or biased data can produce misleading results.
- A sample may not represent the population accurately.
- A relationship between two variables does not automatically prove that one caused the other.
- Statistics can be misinterpreted when context, sample size, or uncertainty is ignored.
Statistical results should therefore be considered alongside the quality of the data, the method used, and the context of the question.
Common Misunderstandings About Statistics
- An average does not describe every individual. Two groups can have the same average but very different distributions.
- A correlation does not prove causation. Two things may change together for reasons that are not directly connected.
- A larger sample is not automatically a better sample. How participants are selected also matters.
- A percentage needs context. Always consider the total number of observations and how the percentage was calculated.
- A forecast is not a certainty. Statistical estimates usually involve some degree of uncertainty.
Frequently Asked Questions
What is statistics in simple words?
Statistics is the study of how to collect, organize, analyze, and understand data. It helps people turn information into useful summaries and evidence.
What are the two main types of statistics?
The two main types are descriptive statistics, which summarizes collected data, and inferential statistics, which uses sample data to draw conclusions about a larger population.
What is an example of statistics?
Calculating the average mark of a class is a simple example. Surveying a sample of customers to estimate overall customer satisfaction is an example of inferential statistics.
Why is statistics important in everyday life?
Statistics helps people understand prices, compare products, interpret polls and forecasts, manage budgets, and evaluate information presented in news and reports.
Is statistics a branch of mathematics?
Statistics is closely connected to mathematics and uses mathematical methods. It is commonly taught as a distinct discipline focused on data, variation, and uncertainty.
What is the difference between descriptive and inferential statistics?
Descriptive statistics summarizes the data that has been observed. Inferential statistics uses sample data to estimate or test claims about a wider population.
Conclusion
Statistics helps people understand information by providing methods to collect, organize, analyze, and interpret data. Its two main branches—descriptive and inferential statistics—allow us to summarize observations and make carefully qualified conclusions about larger groups.
From education and healthcare to business, government, sports, and scientific research, statistics supports decisions in many areas of life. Learning its basic concepts also makes it easier to evaluate surveys, reports, percentages, and claims encountered every day.
References and Further Reading
The following educational and statistical organizations provide additional information about statistical concepts and methods:
- Australian Bureau of Statistics — What statistics are
- Australian Bureau of Statistics — Quantitative and qualitative data
- National Institute of Standards and Technology — Statistical methods and resources (NIST publication)
- National Academies / NCBI — Reference Guide on Statistics and Research Methods
- Penn State — Statistics 200, Lesson 1: Populations and Samples
Disclaimer
This article is for general educational purposes. Examples using hypothetical figures are included to explain statistical concepts and should not be treated as findings from a real research study.