

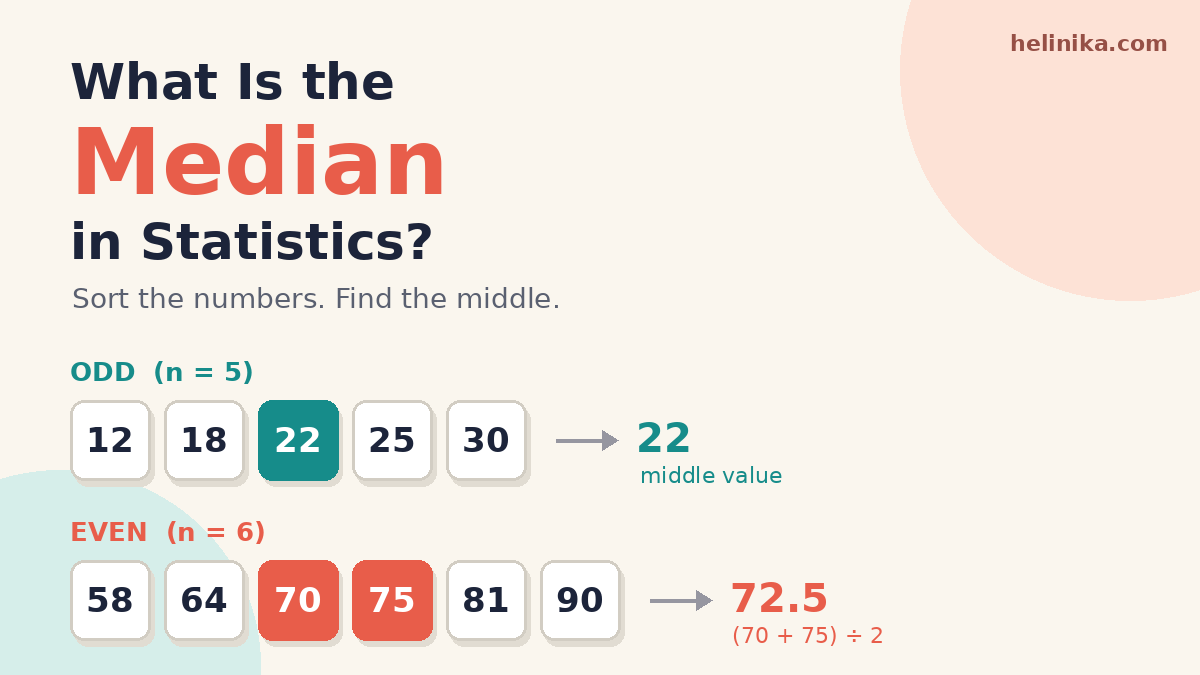
Picture five friends lining up by height. You don’t need a measuring tape to find the “middle” person. You just look at whoever is standing in the third spot, with two people on each side. That person’s height is the median.
Quick Info
| Topic | Detail |
|---|---|
| What it is | The middle value of a data set once it is sorted |
| First step | Always arrange the numbers from smallest to largest |
| Odd number of values | Median = the value at position (n + 1) ÷ 2 |
| Even number of values | Median = average of the two middle values |
| Big strength | Not thrown off by extreme values (outliers) |
| Common uses | Household income, house prices, exam results, wait times |
| Reading time | About 9 minutes |
That’s really all the median is: the value that sits in the middle once everything is in order. Half the data falls below it, half falls above it. Simple idea, but surprisingly powerful.
In this guide, we’ll walk through how to find the middle value step by step. You’ll see exactly what changes when your data has an odd or an even number of values, and we’ll work through plenty of examples together, from short lists to frequency tables and grouped data.
What Is the Median in Statistics?
The median is the middle value of a data set when the values are arranged in order. It splits your data into two equal halves. Statisticians call it a measure of central tendency, the same family as the mean and the mode.
The key word is order. A median only makes sense once the numbers are sorted, either smallest to largest or largest to smallest. Skip that step, and you’ll get the wrong answer almost every time.
The NIST/SEMATECH e-Handbook of Statistical Methods describes the median as the point where half the data sits above and half below. It also points out something worth remembering: when data has extreme values in its tails, the median often gives a better picture of the “typical” value than the mean does.
Why the Median Matters
Here’s a quick story. Five people sit in a café, each earning around 40,000 a month. Then a millionaire walks in. Suddenly, the average income in the room shoots up, even though nobody else got a raise.
The median barely moves. It still points to someone earning around 40,000, which is far closer to the truth for most people in that room. That’s why governments and news reports usually quote median income and median house prices, not the mean.
If you’ve already read our guide on what a mean is in statistics, think of the median as its calmer cousin. The mean listens to every value equally. The median only cares about who’s standing in the middle.
How to Find the Middle Value: Step by Step
Finding the median comes down to four steps. Once you’ve done it a few times, it takes seconds.
- Sort the data. Arrange every value from smallest to largest. Keep repeated values; each one takes its own spot in the line.
- Count the values. Call this number n.
- Check if n is odd or even. This decides which rule you use.
- Pick the middle.
- If n is odd, the median is the single value in the exact middle.
- If n is even, there are two middle values. Add them and divide by 2.
A quick tip from experience: cross out one number from each end at a time, working inwards. Whatever is left in the centre is your median. It’s slow for long lists, but it’s almost impossible to get wrong, and it’s a great way to check your answer.
Odd vs Even Datasets: What Changes?
This is where most students trip up, so let’s slow down. The only thing that changes is how many “middle” values you end up with.
When n Is Odd
An odd count always has one clear middle value. You find its position with this formula:
\text{Median position} = \frac{n + 1}{2}With 7 values, the position is (7 + 1) ÷ 2 = 4. So the median is the 4th value in your sorted list, with three values on each side.
When n Is Even
An even count has no single middle. Instead, two values share the centre. You take their average:
\text{Median} = \frac{\left(\frac{n}{2}\right)^{\text{th}} \text{ value} + \left(\frac{n}{2} + 1\right)^{\text{th}} \text{ value}}{2}With 8 values, the two middle positions are 8 ÷ 2 = 4 and 4 + 1 = 5. So you average the 4th and 5th values.
| Odd n | Even n | |
|---|---|---|
| Middle values | One | Two |
| Position(s) | (n + 1) ÷ 2 | n ÷ 2 and n ÷ 2 + 1 |
| How to get the median | Read it off directly | Average the two middle values |
| Is the median always in the data? | Yes | Not always |
That last row surprises people. With an even dataset, the median can be a number that doesn’t appear anywhere in your list, like 72.5 when all your scores are whole numbers. That’s completely fine.
Solved Examples of the Median
Let’s put the rules to work. We’ll start simple and build up.
Example 1: Odd Dataset (Commute Times)
Sara notes her commute time for five days: 18, 25, 12, 30 and 22 minutes.
- Sorted: 12, 18, 22, 25, 30
- n = 5 (odd), position = (5 + 1) ÷ 2 = 3
- Median = 22 minutes
On a typical day, Sara’s commute takes about 22 minutes.
Example 2: Even Dataset (Test Scores)
Six students scored 64, 81, 75, 90, 58 and 70 on a quiz.
- Sorted: 58, 64, 70, 75, 81, 90
- n = 6 (even), middle positions = 3rd and 4th
- Median = (70 + 75) ÷ 2 = 72.5
Notice that nobody actually scored 72.5. The median sits between two real scores, and that’s perfectly normal.
Example 3: Repeated Values
Find the median of 4, 7, 2, 7, 9, 3, 7, 5, 1.
- Sorted: 1, 2, 3, 4, 5, 7, 7, 7, 9
- n = 9 (odd), position = (9 + 1) ÷ 2 = 5
- Median = 5
The number 7 shows up three times, so it’s tempting to pick it. But 7 is the mode here, not the median. Every repeat takes its own place in the line.
Example 4: Negatives and Decimals
Find the median of −3, 1.5, −0.5, 4, 2, 0.
- Sorted: −3, −0.5, 0, 1.5, 2, 4
- n = 6 (even), middle positions = 3rd and 4th
- Median = (0 + 1.5) ÷ 2 = 0.75
The trick with negatives is sorting them correctly. −3 is smaller than −0.5, so it goes first.
Example 5: When an Outlier Shows Up
Five houses on a street sold for 45, 48, 50, 52 and 300 lakh. The last one is a large corner villa.
- Sorted: 45, 48, 50, 52, 300
- Median = 50 lakh
- Mean = (45 + 48 + 50 + 52 + 300) ÷ 5 = 99 lakh
Ask any buyer on that street what a house costs, and they’ll say “around 50”. The median agrees with them. The mean, pulled up by one villa, is nearly double.
Example 6: Median From a Frequency Table
A shoe shop records the sizes sold in one day. With repeated values, we use cumulative frequency (a running total) to find the middle.
| Shoe size | Pairs sold (f) | Cumulative frequency |
|---|---|---|
| 5 | 4 | 4 |
| 6 | 7 | 11 |
| 7 | 9 | 20 |
| 8 | 6 | 26 |
| 9 | 4 | 30 |
- Total n = 30 (even), so we need the 15th and 16th values.
- Positions 12 to 20 are all size 7 (the cumulative total jumps from 11 to 20 there).
- Both the 15th and 16th values are 7, so median = (7 + 7) ÷ 2 = size 7.
Example 7: Median of Grouped Data
Sometimes data only comes in ranges. Here’s how long 40 students studied on a school night.
| Minutes studied | Students (f) | Cumulative frequency |
|---|---|---|
| 0–20 | 5 | 5 |
| 20–40 | 8 | 13 |
| 40–60 | 12 | 25 |
| 60–80 | 10 | 35 |
| 80–100 | 5 | 40 |
Step 1: Find n ÷ 2 = 40 ÷ 2 = 20.
Step 2: Find the median class, the first class whose cumulative frequency reaches 20. That’s 40–60.
Step 3: Use the grouped median formula:
\text{Median} = L + \left(\frac{\frac{n}{2} - CF}{f}\right) \times h| Symbol | Meaning | Value here |
|---|---|---|
| L | Lower boundary of the median class | 40 |
| n | Total frequency | 40 |
| CF | Cumulative frequency before the median class | 13 |
| f | Frequency of the median class | 12 |
| h | Class width | 20 |
Step 4: Plug in the numbers.
Median = 40 + ((20 − 13) ÷ 12) × 20 = 40 + (7 ÷ 12) × 20 = 40 + 11.67 = 51.67 minutes
The formula assumes students are spread evenly across the 40–60 range, and moves along it in a straight line, the same idea you see when plotting linear equations. That’s why the grouped median is an estimate, not an exact value.
Median vs Mean: Which One Should You Use?
Both try to answer the same question: “What’s a typical value here?” They just go about it differently.
| Median | Mean | |
|---|---|---|
| How it’s found | Middle value after sorting | Sum of values ÷ count |
| Effect of outliers | Barely changes | Can shift a lot |
| Uses every value? | Only their order | Yes, every value counts |
| Best for | Skewed data: income, house prices, wait times | Balanced data without extreme values |
A simple rule of thumb: if your data has a few values far away from the rest, report the median. If the data is fairly balanced, the mean works well. And when you’re unsure, there’s no harm in giving both. If they’re far apart, that gap itself tells a story about your data.
The Australian Bureau of Statistics guide to the median, part of its Statistical Language series, also covers when the median is not a good choice. It’s a short, plain-English read if you want an official statistics agency’s take.
Common Mistakes to Avoid
- Forgetting to sort. This is the number one error. The middle of an unsorted list means nothing.
- Dropping repeated values. If 7 appears three times, it takes three places in the line.
- Using (n + 1) ÷ 2 for even data and stopping. With n = 6, you get 3.5. That’s a hint you need the 3rd and 4th values, not a rounded guess.
- Sorting negatives the wrong way. −10 is smaller than −2, so it goes first.
- Using frequencies as values. In a frequency table, the median is a shoe size (or score), never the frequency count itself.
Where You’ll See the Median in Real Life
- Income and salaries: “median household income” in government reports
- Property: median house or rent prices in a city
- Healthcare: median waiting time at a hospital or clinic
- Education: median marks to see how a typical student performed
- Online shopping: median delivery time, so one lost parcel doesn’t skew the number
Frequently Asked Questions
What is the median in simple words? It’s the middle number once you line up all your values from smallest to largest.
How do you find the median of an even set of numbers? Sort the numbers, find the two in the middle, add them, and divide by 2.
Can the median be a decimal? Yes. With an even number of values, the median is often a decimal, like 72.5, even if all your data are whole numbers.
Does the median have to be one of the numbers in the data? For an odd dataset, yes. For an even dataset, not always, because it’s the average of two values.
Why is the median better than the mean sometimes? Because it isn’t pulled around by extreme values. One very large or very small number hardly affects it.
What if the two middle values are the same? Then the median is simply that value. For example, the median of 3, 5, 5, 8 is (5 + 5) ÷ 2 = 5.
Conclusion
The median is about as friendly as statistics gets. Sort your numbers, count them, and look at the middle. If there’s one middle value, that’s your answer. If there are two, average them. For frequency tables, a running total does the work, and for grouped data, one formula gives you a solid estimate.
The real skill is knowing when to reach for it. Whenever a few extreme values could tell a misleading story, the median keeps things honest. Try it on something from your own life, like your weekly screen time or monthly bills, and it’ll stick for good. And if you like having key math rules in one place, our geometry formulas cheat sheet is worth bookmarking too.
References
- NIST/SEMATECH e-Handbook of Statistical Methods – Measures of Location
- Australian Bureau of Statistics – Statistical Language: Median
Disclaimer
This article is for general educational purposes only. All examples use simplified, made-up data to explain the concept clearly. Methods and rounding rules can differ between textbooks and exam boards, so always follow your teacher’s or syllabus guidelines for exams. For research or professional data work, consult a qualified statistician.