

Quick Info
| Topic | Detail |
|---|---|
| What it is | The value that appears most often in a data set |
| How to find it | Count how many times each value appears; pick the highest count |
| Can there be more than one? | Yes: two modes (bimodal) or more (multimodal) |
| Can there be none? | Yes, when every value appears equally often |
| Works with words? | Yes, it’s the only average that works for categories like colours or brands |
| Common uses | Best-selling sizes, most popular choices, survey answers |
| Reading time | About 9 minutes |
Walk into any shoe shop and ask the owner which size sells most. They won’t pull out a calculator. They’ll just say, “Size 7, by a mile.” Without knowing it, they’ve just told you the mode.
The mode is the most “popular” value in your data, the one that shows up more than any other. It’s the easiest average to find, and in some situations it’s the only one that makes sense.
In this guide, we’ll look at how to spot the most frequent value, the different kinds of datasets you’ll run into (one mode, two modes, or none at all), and plenty of worked examples. Then we’ll put the mode side by side with the mean, so you know exactly when to use which.
What Is Mode in Statistics?
The mode is the value that occurs most frequently in a data set. If you count how often each value appears, the one with the biggest count is the mode. Along with the mean and median, it’s one of the three main measures of central tendency.
The Australian Bureau of Statistics’ guide to the mode, from its Statistical Language series, explains it in the same everyday terms: the most common value in a group. The guide also has short sections on what the mode tells you and when it’s a poor choice, which is worth a look if you like official sources.
There’s no formula to memorise for a simple list. You just count. That’s what makes the mode so approachable.
How to Find the Most Frequent Value
- Organise the data. Sorting isn’t required, but it makes repeats far easier to spot.
- Count each value. A quick tally (or a frequency table) works best.
- Find the highest count. The value with that count is the mode.
- Check for ties. If two or more values share the highest count, they’re all modes.
Here’s a small tally for the numbers 3, 7, 2, 7, 5, 9, 7, 4:
| Value | Tally | Count |
|---|---|---|
| 2 | I | 1 |
| 3 | I | 1 |
| 4 | I | 1 |
| 5 | I | 1 |
| 7 | III | 3 |
| 9 | I | 1 |
The number 7 appears three times, more than anything else, so the mode is 7.
One thing to keep straight: the mode is the value (7), not the count (3). Mixing those two up is the most common slip students make.
Types of Datasets Based on Mode
Unlike the mean and median, a dataset doesn’t always have exactly one mode. It might have one, two, several, or none at all. Each case has a name.
| Type | What it means | Example data | Mode |
|---|---|---|---|
| Unimodal | One value appears most often | 2, 4, 4, 4, 6, 8 | 4 |
| Bimodal | Two values tie for most frequent | 12, 15, 15, 18, 20, 20, 22 | 15 and 20 |
| Multimodal | Three or more values tie | 1, 1, 3, 3, 5, 5, 9 | 1, 3 and 5 |
| No mode | Every value appears the same number of times | 4, 8, 11, 15, 19 | None |
Unimodal Data
This is the most common case. One value clearly stands out, like 4 in the example above. Most textbook questions use unimodal data.
Bimodal Data
Bimodal data often tells you something interesting is going on. Imagine a café that gets a rush at 8 a.m. and another at 1 p.m. If you recorded the hour of every order, you’d see two peaks: breakfast and lunch. Two modes usually mean two different groups are mixed together in your data.
Multimodal Data
When three or more values share the top spot, the data is multimodal. In practice, this often means the mode isn’t telling you much, and the mean or median may be more useful.
Data With No Mode
If every value appears just once (or the same number of times), there’s no mode. A common mistake is to write “0” as the answer. Don’t. Zero would mean the value 0 is the most common. The right answer is simply “no mode”.
Mode With Categorical Data
Here’s where the mode really shines. You can’t add up colours or find the middle of a list of car brands. But you can count which one appears most. That makes the mode the only average that works for categorical (non-numeric) data, such as favourite foods, blood groups, or shirt colours.
Solved Examples of the Mode
Example 1: A Simple List
A cricket team’s scores in eight overs: 6, 4, 9, 4, 12, 4, 6, 8.
- 4 appears 3 times, 6 appears 2 times, everything else once.
- Mode = 4 runs
Example 2: Two Modes (Bimodal)
Ages of children at a birthday party: 6, 8, 8, 9, 11, 11, 12.
- 8 appears twice, 11 appears twice, others once.
- Modes = 8 and 11
This makes sense if the birthday child invited friends from two different classes.
Example 3: No Mode
Daily steps (in thousands) over five days: 4.2, 6.8, 5.1, 7.3, 3.9.
- Each value appears exactly once.
- No mode.
Example 4: Categorical Data (Words, Not Numbers)
A maths teacher sorts the 20 angles on a geometry worksheet by type.
| Angle type | Count |
|---|---|
| Acute | 9 |
| Right | 4 |
| Obtuse | 5 |
| Straight | 2 |
Mode = acute angles. You couldn’t find a mean or median here, because “acute” and “obtuse” aren’t numbers. If you need a quick refresher on the four types, see our guide to acute, obtuse, right and straight angles.
Example 5: Frequency Table
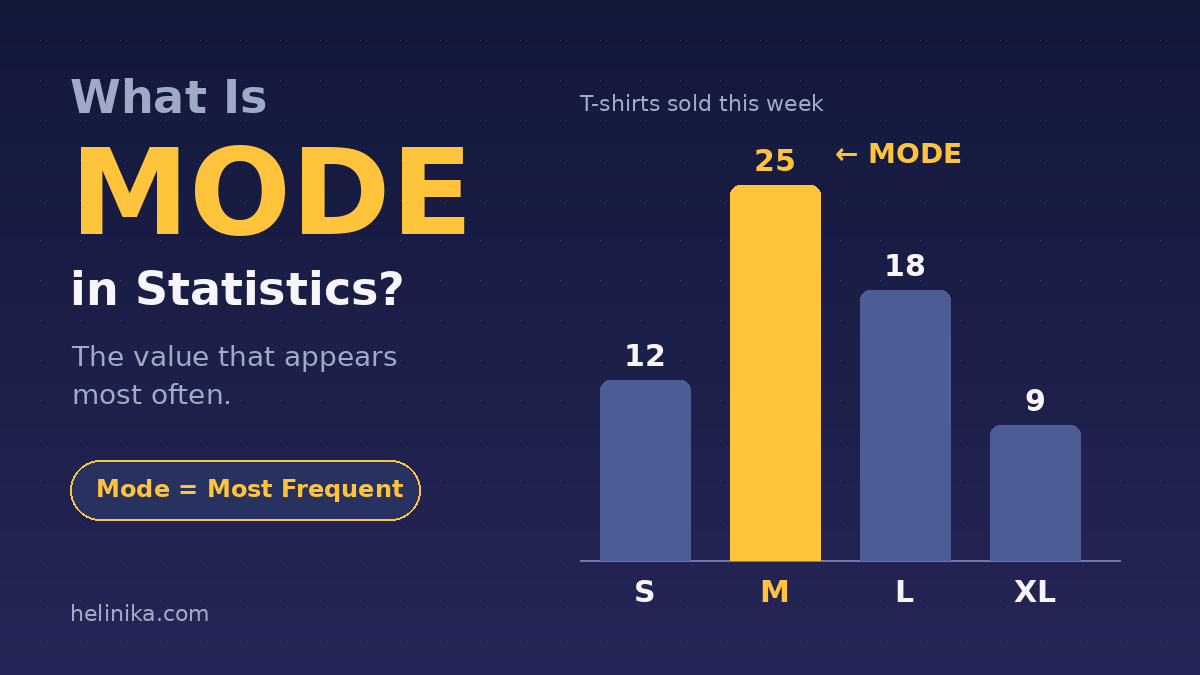
A clothing store’s T-shirt sales for one week:
| Size | Shirts sold (f) |
|---|---|
| S | 12 |
| M | 25 |
| L | 18 |
| XL | 9 |
The highest frequency is 25, so the mode is size M. Notice the answer is the size, not 25. That’s exactly the number the store manager needs when reordering stock.
Example 6: Mode of Grouped Data
When data comes in ranges, we first find the modal class (the class with the highest frequency), then estimate the mode inside it. Here are the customers visiting a small shop each day for 40 days.
| Customers per day | Days (f) |
|---|---|
| 0–10 | 3 |
| 10–20 | 8 |
| 20–30 | 14 |
| 30–40 | 9 |
| 40–50 | 6 |
The modal class is 20–30 (frequency 14). Now use the grouped mode formula:
\text{Mode} = L + \left(\frac{f_1 - f_0}{2f_1 - f_0 - f_2}\right) \times h| Symbol | Meaning | Value here |
|---|---|---|
| L | Lower boundary of the modal class | 20 |
| f₁ | Frequency of the modal class | 14 |
| f₀ | Frequency of the class before it | 8 |
| f₂ | Frequency of the class after it | 9 |
| h | Class width | 10 |
Mode = 20 + ((14 − 8) ÷ (28 − 8 − 9)) × 10 = 20 + (6 ÷ 11) × 10 = 20 + 5.45 = 25.45 customers per day
The bigger neighbouring class pulls the mode towards it. Here the class after (9 days) is slightly bigger than the class before (8 days), so the mode lands just above 25, the middle of the class. Like the grouped mean and median, this answer is an estimate.
Example 7: When Mode and Mean Disagree
A shoe shop sells these sizes in one morning: 6, 7, 7, 7, 7, 9, 10, 11.
- Mode = 7 (sold 4 times)
- Mean = (6 + 7 + 7 + 7 + 7 + 9 + 10 + 11) ÷ 8 = 64 ÷ 8 = 8
Here’s the funny part: not a single customer bought size 8. If the owner restocked based on the mean, they’d fill the shelves with a size nobody asked for. The mode points straight at what actually sells.
Mode vs Mean: What’s the Difference?
Both try to describe a “typical” value, but they answer slightly different questions. The mean asks, “If everything were shared equally, what would each get?” The mode asks, “What shows up most?”
| Mode | Mean | |
|---|---|---|
| What it tells you | The most common value | The equal-share average |
| How to find it | Count and pick the highest frequency | Add all values, divide by the count |
| Works with words/categories? | Yes | No |
| Affected by outliers? | No | Yes, strongly |
| Always unique? | No: can have 0, 1, 2 or more | Yes, always exactly one |
| Uses every value? | No, only the most frequent | Yes |
| Is it always a real data value? | Yes | Not always (e.g. 2.4 children) |
| Best for | Popular choices, sizes, survey answers | Balanced numeric data like test scores |
The NIST/SEMATECH e-Handbook of Statistical Methods lists the mean, median and mode as the three standard ways to describe a typical value. It also notes that for perfectly symmetric data, all three land in the same spot. When data is lopsided, they drift apart, and that’s when choosing the right one matters.
When to Use the Mode
- You’re working with categories (colours, brands, blood groups)
- You want the most popular option, like a best-selling size
- You want an actual value from the data, not an in-between figure
When to Use the Mean
- Your data is numeric and fairly balanced
- Every value should count, like total marks across a class
- You plan further calculations, such as standard deviation
For a full walkthrough of the mean, including frequency tables and grouped data, see our guide on what a mean is in statistics. The median sits between the two, and it’s the go-to choice when a few extreme values would distort the mean.
Advantages and Limitations of the Mode
Advantages
- The easiest average to find, often just by looking
- Works for both numbers and categories
- Not affected by extreme values
- Always an actual value from the data
Limitations
- Some datasets have no mode, or too many to be useful
- Ignores most of the data, so it can miss the bigger picture
- Can change a lot if just one or two values change
- For grouped data, it’s only an estimate
Common Mistakes to Avoid
- Giving the count instead of the value. If 7 appears 3 times, the mode is 7, not 3.
- Writing “0” for no mode. If nothing repeats, the answer is “no mode”.
- Picking only one mode when there’s a tie. If two values share the top count, list both.
- Using a frequency table’s biggest number as the answer. The mode is the value (like size M), not its frequency (25).
- Assuming the mode is near the middle. It can sit anywhere: at the start, end or middle of the data.
Frequently Asked Questions
What is mode in simple words? The mode is the value that appears most often in a set of data.
Can a dataset have more than one mode? Yes. Two modes make it bimodal, and three or more make it multimodal.
What if no number repeats? Then the data has no mode. Write “no mode”, not 0.
Can the mode be used for words or categories? Yes. It’s the only measure of central tendency that works for non-numeric data, like favourite colours.
Which is better, mode or mean? Neither is always better. Use the mode for the most popular choice or for categories; use the mean for balanced numeric data.
Is the mode affected by outliers? No. A single extreme value appears only once, so it can’t become the mode unless it repeats more than anything else.
Conclusion
The mode is the simplest average of all: count how often each value appears and pick the winner. Some datasets have one mode, some have two or more, and some have none, and each of those tells you something about your data.
What makes the mode special is where it works when others can’t: categories, popular choices, and real-world decisions like which size to restock. Paired with the mean, it gives you a fuller picture than either one alone. Once you’re comfortable with averages, a great next step in your maths practice is learning how to use the Pythagoras theorem to find missing sides.
References
- Australian Bureau of Statistics – Statistical Language: Mode
- NIST/SEMATECH e-Handbook of Statistical Methods – Measures of Location
Disclaimer
This article is for general educational purposes only. All examples use simplified, made-up data to explain the concept clearly. Formulas and rounding conventions can vary slightly between textbooks and exam boards, so always follow your teacher’s or syllabus guidelines for exams. For research or professional data analysis, consult a qualified statistician.