

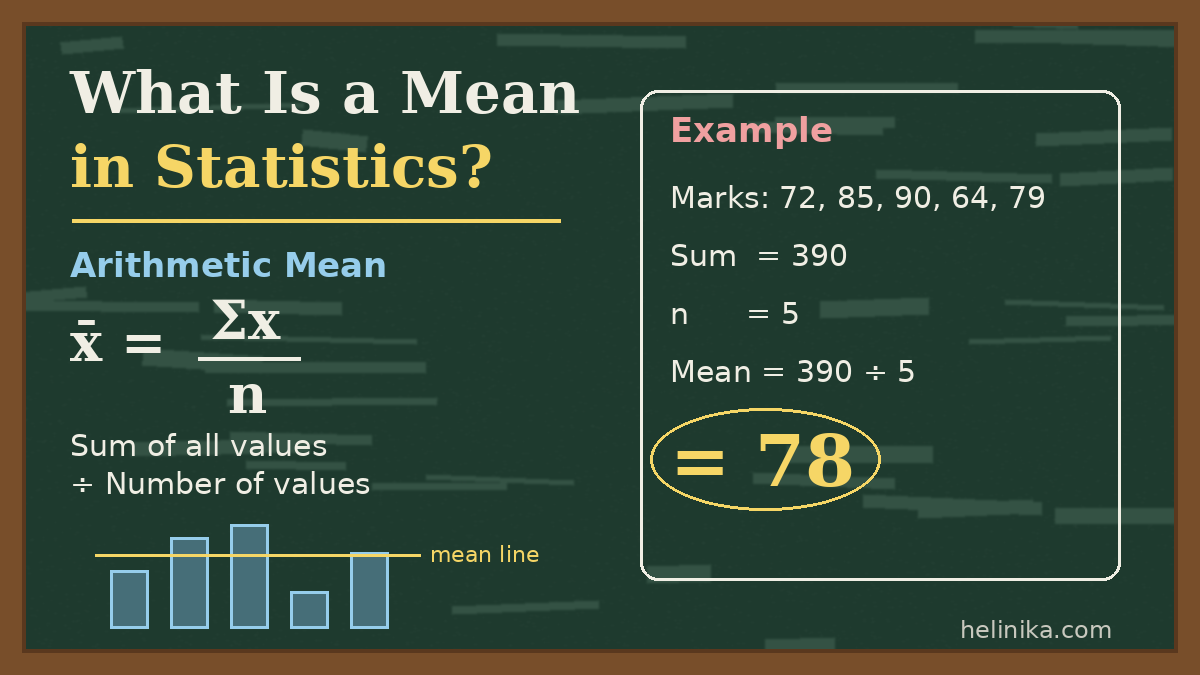
You check your exam marks. Five subjects, five different scores. Someone asks, “So, how did you do overall?” You don’t read out all five numbers. You add them up, divide by five, and give one number. That number is the mean.
Quick Info
| Topic | Detail |
|---|---|
| What it is | The mean is the “average” of a set of numbers |
| Most common type | Arithmetic mean |
| Basic formula | Mean = Sum of all values ÷ Number of values |
| Symbol | x̄ (sample mean) or μ (population mean) |
| Used in | School math, exams, business reports, sports stats, science, finance |
| Best for | Data without extreme outliers |
| Reading time | About 10 minutes |
The mean is the first idea most students meet in statistics. It is also the one adults use most, often without noticing. Average salary, average rainfall, a cricketer’s batting average, the average price of petrol this month. All of these are means.
In this guide, you will learn what a mean is, how the arithmetic mean works, and how to calculate it step by step. We will solve examples for simple lists, frequency tables, and grouped data. You will also see when the mean works well and when it can mislead you.
What Is a Mean in Statistics?
The mean is a single number that represents the centre, or “typical value”, of a data set. Statisticians call it a measure of central tendency. The other two common measures are the median (the middle value) and the mode (the most frequent value).
When people say “average” in daily life, they almost always mean the arithmetic mean. The NIST/SEMATECH e-Handbook of Statistical Methods defines the mean in exactly this plain way: add up the data points and divide by how many there are. The handbook also treats “average” and “mean” as the same thing, which is how this article uses them.
There is more than one kind of mean. The geometric mean and harmonic mean are used in finance and physics. But unless a question says otherwise, “mean” always refers to the arithmetic mean.
What Is the Arithmetic Mean?
The arithmetic mean is the sum of all values divided by the number of values. Think of it as “sharing equally”. If four friends have 2, 4, 6 and 8 sweets, and they pool them and share fairly, each gets 5. That fair share is the mean.
This “fair share” picture also explains why the mean sits in the middle. Values above the mean are balanced by values below it. In the sweets example, 8 is 3 above 5 and 2 is 3 below. 6 is 1 above and 4 is 1 below. The gaps cancel out exactly.
The Arithmetic Mean Formula
For a sample of n values, the formula is:
\bar{x} = \frac{x_1 + x_2 + x_3 + \dots + x_n}{n} = \frac{\sum x}{n}For a whole population of N values, the formula looks the same but uses different symbols:
\mu = \frac{\sum x}{N}| Symbol | Meaning |
|---|---|
| x̄ (x-bar) | Sample mean |
| μ (mu) | Population mean |
| Σ (sigma) | “Add them all up” |
| x | Each individual value |
| n or N | Number of values (sample or population) |
The calculation is identical in both cases. The symbol only tells you whether your data is a sample (part of a group) or the full population (everyone in the group).
How to Calculate the Mean: Step-by-Step Method
Calculating the mean takes four simple steps. The same steps work whether you have 3 numbers or 3,000.
- List all the values. Write every number in the data set. Do not skip repeated values; each one counts.
- Add them together. This gives you the sum, written as Σx.
- Count the values. This gives you n. Count carefully, especially when values repeat.
- Divide the sum by the count. Mean = Σx ÷ n. Round only at the end, if needed.
A quick check helps catch mistakes. Your answer must always lie between the smallest and largest values in the data. If your data runs from 10 to 50 and you get a mean of 72, something went wrong.
If you enjoy step-by-step methods like this, our guide on how to solve trigonometric identities step-by-step uses the same “one clear step at a time” approach for a harder topic.
Solved Examples of the Arithmetic Mean
The best way to learn the mean is to work through real numbers. The examples below start easy and build up to frequency tables and grouped data.
Example 1: Exam Marks (Simple List)
Ali scored 72, 85, 90, 64 and 79 in five subjects. What is his mean score?
- Sum: 72 + 85 + 90 + 64 + 79 = 390
- Count: n = 5
- Mean: 390 ÷ 5 = 78
Ali’s mean score is 78 marks.
Example 2: Weekly Temperatures (Decimal Answer)
The highest temperatures in a week were 31, 29, 33, 35, 30, 28 and 32 °C.
- Sum: 31 + 29 + 33 + 35 + 30 + 28 + 32 = 218
- Count: n = 7
- Mean: 218 ÷ 7 = 31.142… ≈ 31.1 °C
The mean does not have to be one of the original values. Here it is a decimal, even though every reading was a whole number.
Example 3: Data With Negative Numbers
Find the mean of −4, −1, 0, 3 and 7.
- Sum: (−4) + (−1) + 0 + 3 + 7 = 5
- Count: n = 5
- Mean: 5 ÷ 5 = 1
Negative values are added like any other number. Zero still counts as a value, so n is 5, not 4.
Example 4: Measuring a Coin (Real-World Measurement)
A student measures a coin’s diameter five times: 2.42, 2.40, 2.43, 2.41 and 2.44 cm. Each reading is slightly different because no measurement is perfect.
- Sum: 2.42 + 2.40 + 2.43 + 2.41 + 2.44 = 12.10
- Mean: 12.10 ÷ 5 = 2.42 cm
Scientists use the mean like this to reduce small measuring errors. The student can now use 2.42 cm as the diameter to find the coin’s area. If you want to try that next step, see our guide on how to calculate the area and circumference of a circle.
Example 5: Mean From a Frequency Table
When values repeat many times, a frequency table saves effort. Here are the goals scored by a team across 20 matches.
| Goals (x) | Matches (f) | f × x |
|---|---|---|
| 0 | 3 | 0 |
| 1 | 5 | 5 |
| 2 | 6 | 12 |
| 3 | 4 | 12 |
| 4 | 2 | 8 |
| Total | Σf = 20 | Σfx = 37 |
The formula for a frequency table is:
\bar{x} = \frac{\sum f x}{\sum f}Mean = 37 ÷ 20 = 1.85 goals per match.
A common mistake is dividing by 5 (the number of rows). Always divide by Σf, the total number of matches.
Example 6: Mean of Grouped Data
Sometimes data comes in ranges, not exact values. Below are test marks for 30 students. Since we don’t know each exact mark, we use the midpoint of each class as its value.
| Marks | Students (f) | Midpoint (x) | f × x |
|---|---|---|---|
| 0–10 | 4 | 5 | 20 |
| 10–20 | 6 | 15 | 90 |
| 20–30 | 10 | 25 | 250 |
| 30–40 | 7 | 35 | 245 |
| 40–50 | 3 | 45 | 135 |
| Total | Σf = 30 | Σfx = 740 |
Mean = 740 ÷ 30 = 24.67 ≈ 24.7 marks.
This answer is an estimate, not an exact mean. The midpoint method assumes the marks inside each class are spread evenly around its centre.
Example 7: Finding a Missing Value
The mean of five numbers is 12. Four of them are 10, 14, 9 and 17. What is the fifth number?
- Total of all five = Mean × n = 12 × 5 = 60
- Sum of the four known numbers = 10 + 14 + 9 + 17 = 50
- Missing number = 60 − 50 = 10
This “reverse” question appears often in school exams. The trick is that Mean × n always gives the total.
Example 8: How an Outlier Changes the Mean
Five employees at a small firm earn these monthly salaries (in thousands): 30, 32, 33, 35 and 250. The last one is the owner.
- Sum: 30 + 32 + 33 + 35 + 250 = 380
- Mean: 380 ÷ 5 = 76 thousand
Four of the five people earn far less than 76 thousand. The single large value has pulled the mean upward. The median here is 33 thousand, which describes a typical worker much better. We explain this in more detail below.
Key Properties of the Arithmetic Mean
These properties make the mean easy to work with and useful in exam shortcuts.
- Deviations add up to zero. If you subtract the mean from every value and add the results, you always get 0. This is the “balance point” idea from the sweets example.
- Adding a constant shifts the mean. Add 5 to every value, and the mean also goes up by exactly 5.
- Multiplying scales the mean. Double every value, and the mean doubles too.
- Every value counts. Change any single value, and the mean changes. This is a strength and a weakness.
- It may not be a real data value. A family can’t have 2.4 children, but a mean of 2.4 children is perfectly valid.
Mean vs Median vs Mode
All three describe the centre of data, but they do it differently. Choosing the right one matters.
| Measure | How to find it | Affected by outliers? | Best used when |
|---|---|---|---|
| Mean | Add all values, divide by count | Yes, strongly | Data is fairly symmetric, no extreme values |
| Median | Middle value after sorting | Hardly at all | Data has outliers or is skewed (e.g. incomes, house prices) |
| Mode | Most frequent value | No | Categories or “most popular” questions (e.g. shoe sizes) |
In a perfectly symmetric data set, the mean, median and mode are all equal. When data is skewed, they separate. That’s why news reports on income often quote the median: a few very rich people would push the mean far above what most people earn, just like the owner’s salary in Example 8.
Encyclopaedia Britannica’s entry on the mean places the arithmetic mean alongside other types such as the geometric and quadratic means. It is a useful next read if you want to see how these “other averages” are defined and where each one is used.
Advantages and Limitations of the Mean
Advantages
- Simple to understand and quick to calculate
- Uses every value in the data set, so no information is wasted
- Works well for further math, such as variance and standard deviation
- Widely recognised, so results are easy to communicate
Limitations
- Pulled strongly by outliers and extreme values
- Can give a misleading “typical” value for skewed data
- Cannot be used for categories like colours or names
- For grouped data, it is only an estimate
Common Mistakes When Calculating the Mean
- Dividing by the wrong number. In a frequency table, divide by Σf, not by the number of rows.
- Forgetting zeros. A score of 0 is still a value and must be counted in n.
- Rounding too early. Keep full decimals until the final step, then round.
- Ignoring negative signs. −4 + 7 is 3, not 11.
- Using the mean for skewed data without checking. Look for outliers first. If there are some, report the median as well.
Real-Life Uses of the Mean
- Education: average marks, class performance, GPA calculations
- Sports: a batsman’s batting average, a team’s goals per match
- Business: average monthly sales, average order value
- Weather: average rainfall and temperature for a month or season
- Science: averaging repeated measurements to reduce error
Frequently Asked Questions
What is the mean in simple words? The mean is the average. Add all the numbers, then divide by how many numbers there are.
Is mean the same as average? In everyday use, yes. Strictly, “average” can refer to the mean, median or mode, but most people use it to mean the arithmetic mean.
What is the formula of the arithmetic mean? Mean = Σx ÷ n, where Σx is the sum of all values and n is the number of values.
Can the mean be a decimal or negative? Yes. The mean can be a decimal, a fraction, or a negative number, depending on the data.
What is the difference between x̄ and μ? x̄ is the mean of a sample (part of a group). μ is the mean of the whole population. The calculation is the same.
How do you find the mean of grouped data? Find the midpoint of each class, multiply it by the frequency, add these products, and divide by the total frequency.
When should I use the median instead of the mean? Use the median when your data has extreme values or is heavily skewed, such as incomes or property prices.
Conclusion
The mean is the most widely used measure in statistics, and now you know exactly how it works. Add the values, count them, and divide. For frequency tables, multiply first and divide by the total frequency. For grouped data, use midpoints and treat the answer as an estimate.
Just remember its one weakness: outliers. When a few extreme values sit far from the rest, check the median too. Keep practising with your own numbers, such as your marks or monthly expenses, and the method will become automatic. When you’re ready for higher-level math, keep our derivative and integral formulas sheet for calculus close at hand.
References
- NIST/SEMATECH e-Handbook of Statistical Methods – Measures of Location
- Encyclopaedia Britannica – Mean
Disclaimer
This article is for general educational purposes only. The examples use simplified, made-up data to explain concepts clearly. For exam preparation, always follow the methods and rounding rules set by your teacher, textbook or examination board. For research or professional data analysis, consult a qualified statistician.